

When Greenchip was initially founded in 2008, it would have been hard to imagine how prolific the word “carbon” would become in the financial services industry. Now 15 years later, almost every publicly traded fund publishes its weighted average carbon intensity (WACI) metric and there is continued investor momentum around allocating capital to low carbon strategies.
Greenchip has always tried to stay clear of environmental oversimplifications and buzzwords, as we feel that it can distract capital investment away from where it is needed to make real environmental change and generate superior investment returns. In this note, we highlight some of our research on carbon emissions metrics and how they can be both helpful and harmful when making investment decisions.
Background on emissions accounting
Carbon emissions (often used synonymously for greenhouse gas (GHG) emissions) are the release of a group of gases that trap heat in Earth’s atmosphere. Carbon dioxide (CO2) is the most well-known GHG, but the list includes methane (CH4), nitrous oxide (N2O), and others.
Companies categorize and report the emissions associated with their operations under three scopes:
- Scope 1 covers the emissions from sources that a company owns or controls, for example the emissions that a large car company would generate by manufacturing a car engine.
- Scope 2 covers the emissions that are created indirectly through purchased energy (including the purchases of electricity, heat, steam and cooling). For example, scope 2 emissions would come from the energy purchased by the car company to power its engine manufacturing facility.
- Scope 3 covers the emissions that a company is indirectly responsible for, both upstream and downstream in its value chain. For example, the emissions associated with the production of the cast iron used in the car engine would be considered upstream scope 3 emissions.
On the other hand, the emissions created by the customer driving the finished car would be downstream scope 3 emissions. Understandably, scope 3 emissions are very challenging to measure and consequently are not widely or accurately reported.
To compare the emissions of different companies the absolute volume of scope 1 and 2 emissions must be normalized by a common unit of activity, which produces a carbon intensity metric. It is best practice to use a unit of activity specific to the industry, such as tonnes of ammonia produced for the fertilizer industry, but for more broad comparability, millions of dollars of revenue is often used. Based on the guidance from the GHG Protocol for financial services, scope 3 emissions are not included in intensity calculations.
To recap:
Carbon intensity = scope 1 and 2 emissions (tonnes of CO2e)
revenue (millions of USD)
OR
Carbon Intensity = scope 1 and 2 emissions (tonnes of CO2e)
tonnes of ammonia produced
Fertilizer: a helpful example on emissions accounting complexity
In fall 2022, we wanted to better understand the emissions associated with the fertilizer industry, which makes up around 7% of the assets that we manage. Fertilizers, most notably those that are nitrogen-based, can be controversial from an environmental perspective. While they are essential to sustainably feed the world’s population of eight billion people, their production is highly emissions intensive and contributes 2.1% of global GHG emissions1.
Most of the emissions associated with the industry come from the production of ammonia, which is the base chemical for all forms of nitrogen-based fertilizers. Ammonia production uses natural gas for its source of hydrogen, and consequently emits CO2 as a by-product. It also requires intense heat and pressure, which is often powered by fossil fuel-based energy, further contributing to emissions.
For our analysis, we looked at the emissions produced by four of the world’s largest nitrogen-based fertilizer producers. The following two charts show the publicly reported emissions intensities, with chart #1 using revenue and chart #2 using a derivative of the volume of ammonia produced to normalize emissions.
Chart #1: Publicly Reported Emissions Intensities by Revenue (M USD)
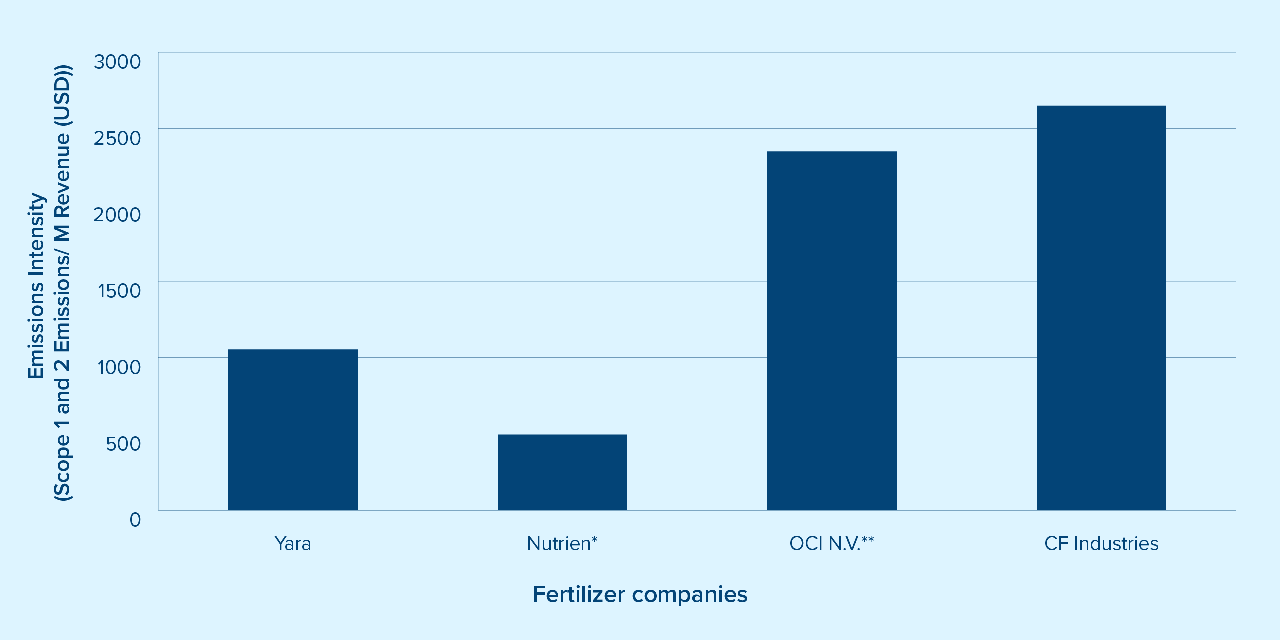
Chart #2: Publicly Reported Emissions Intensities by Volume of Production
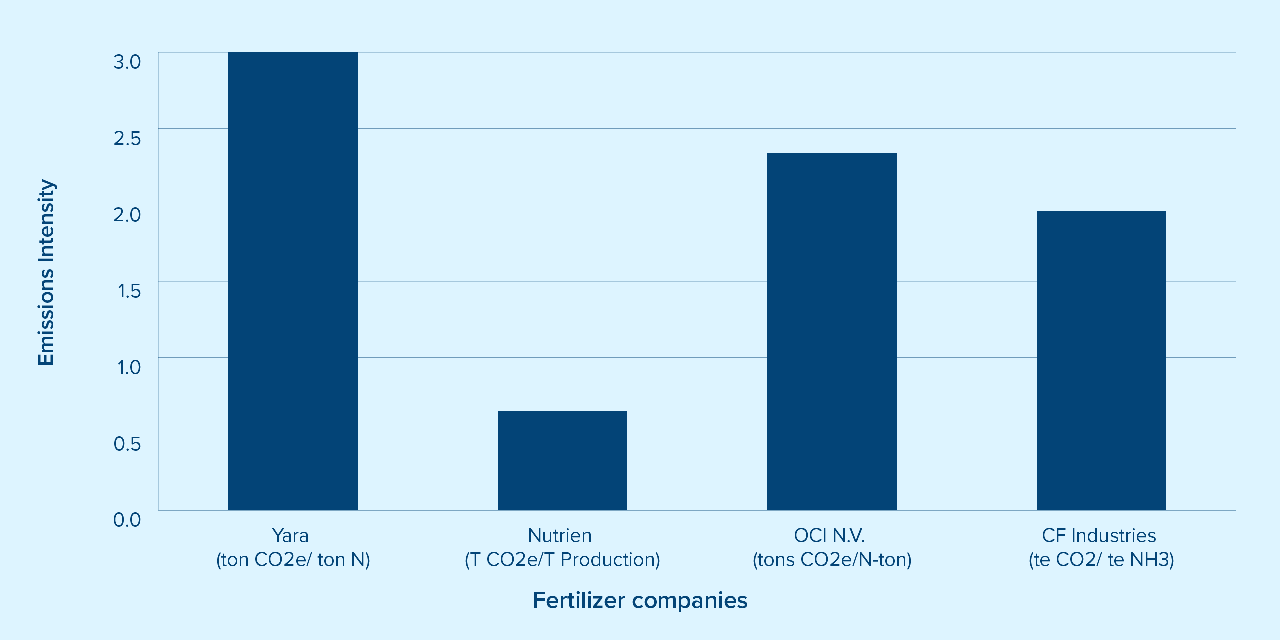
At face value, the two charts draw different conclusions about which companies produce higher levels of emissions. We then spent the next several months researching and engaging with the companies to better understand the assumptions and methodologies that were used to calculate emissions. We discovered that a lack of global standardization was creating significant differences in how carbon intensity was calculated by each company. Let’s look further into some of the challenges that we identified and the corresponding impacts at three levels: sector, company and portfolio.
The challenges of comparing emissions across a sector
Inconsistencies with scope inclusion
The most notable problem was a difference in methodologies used, with two of the companies following the GHG Protocol Corporate Accounting and Reporting Standard and two following the standard of the EU Emissions Trading System (ETS). This meant the activities included in each scope of emissions differed. For example, the EU ETS specifies that the downstream emissions from urea must be counted as a scope 1 emission, whereas the GHG Protocol counts them as scope 3 emissions.
Urea is a solid form of nitrogen-based fertilizer that contains 0.733 kg CO2e that is released upon application for every 1 kg applied. The companies that we looked at produce 16-39% of their total fertilizer production in the form of urea, which meant that there was a significant amount of CO2 that was either being added or left out of the emissions calculation depending on the methodology that was used. For Yara, this equated to almost 21% of scope 1 emissions.
Another problem was the lack of standardization relating to inclusion along the value chain. The more vertically integrated a company is, the higher the scope 1 and 2 emissions, due to the company being directly responsible for a larger portion of production. For fertilizer companies, this translated into differences in emissions depending on how much ammonia was purchased or produced and whether the captured CO2 that was sold to industrial customers (to add fizz to soda drinks or to produce dry ice to transport food) was included in calculations.
We also noted that the major data providers for scope 1 and 2 absolute emissions (MSCI, S&P and Bloomberg) did not correct for these differences, which meant that the discrepancies in the data are being passed to the industry at large.
The challenges of finding a common unit of activity
The problem with industry reporting becomes more complicated when looking at the range of denominators used. As seen in chart #2 there are many ways to measure the volume of production. Some companies use a weighted average of products produced, whereas others use tonnes of ammonia or nitrogen. Even though they all produce nitrogen-based fertilizer commodities, each company has an opinion on which unit is the most representative of its carbon intensity.
On the other hand, using revenue as the denominator is extremely problematic given the volatility of input pricing. This issue arose over the past few years as natural gas prices soared. This is a bit complicated, but the details matter. Using CF Industries as an example, from 2020-2021 revenue grew by an unusual 58%, primarily because natural gas prices spiked. In this same period the volume of ammonia produced decreased by 10% and consequently emissions were reduced by 7%. Measuring CF Industry’s carbon intensity using revenue as the denominator would be completely misleading, as it would show a 42% year-over-year decrease that could easily be interpreted as a dramatic improvement in the company’s emissions efficiency.
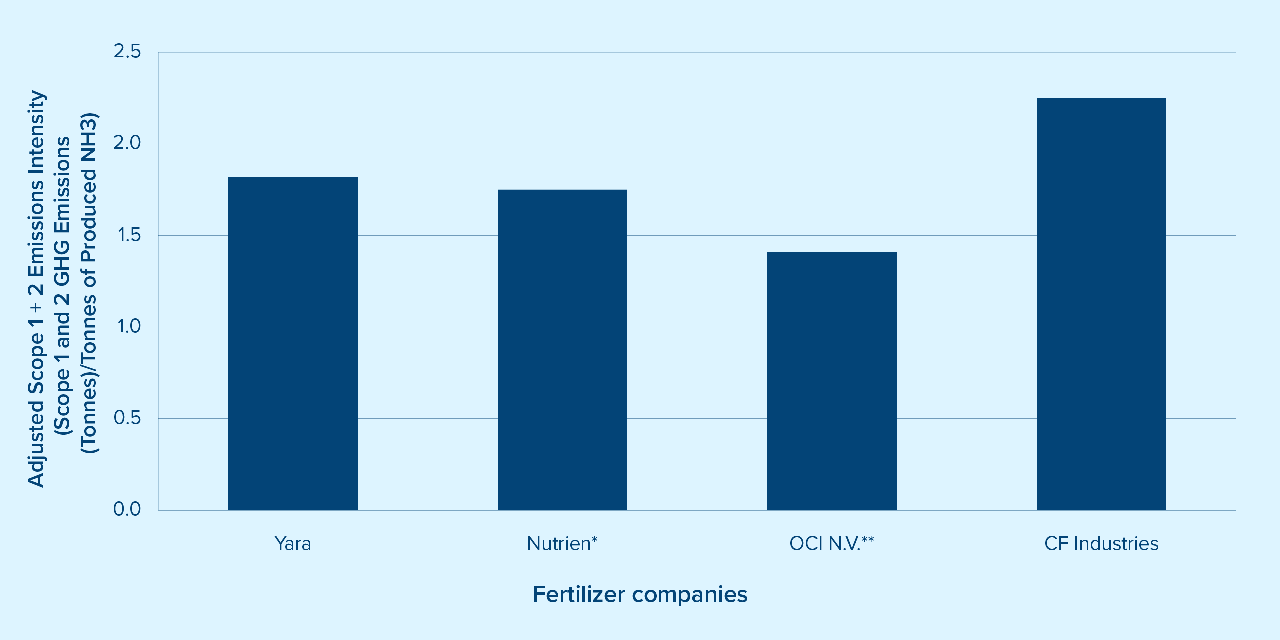
The chart below shows Greenchip’s calculations of the carbon intensity of nitrogen-based fertilizers for the four companies, after normalizing for assumptions and methodology based on our research. As can be seen, our results show a completely different emissions intensity profile. Relying on reported data alone provides misleading information to investors.
Chart #3: Calculated Normalized Emissions Intensities
Note:
*Following the normalization process, the emissions for Nutrien only reflect the nitrogen production operational unit. Nutrien also produces potash and phosphate fertilizers, which are less emissions intensive and lowered the carbon intensity in charts 1 and 2.
** Following the normalization process the emissions for OCI N.V. only reflect the company’s nitrogen production activities. OCI N.V. also produces methanol as ~15% of total production.
Comparing emissions at the company level over time can be useful
Where emissions metrics can be helpful is at a single company level. Understanding, measuring, and reporting emissions is critical for a company to set near and long-term targets that effectively reduce all scopes of emissions. Year over year, intensity metrics that use the same methodology, assumptions and appropriate volume metric for the denominator are an effective way to measure changes in production efficiency. At the end of the day, the world needs to reduce global emissions by around 37 billion metric tons to avoid the worst effects of the climate crisis, so companies should be rewarded for both reductions in total emissions and the ability to produce with lower emissions per unit.
Why carbon accounting at a portfolio level can be misleading
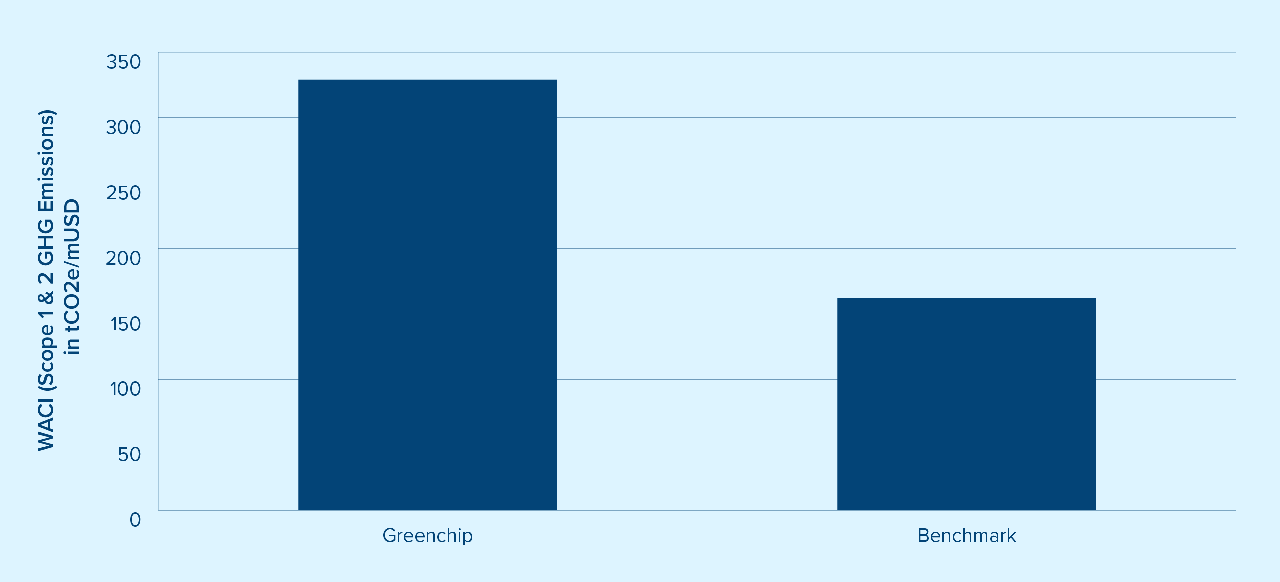
When these findings are extrapolated to the portfolio level the flaws of the most widely used metric to evaluate the carbon intensity of a fund, WACI, can be seen. WACI is calculated by multiplying portfolio weights by the corresponding carbon intensity (calculated using revenue as the denominator). Funds that invest in companies that are asset light, are further down the value chain, operate in markets with high value currencies, or use more exclusive GHG measurement methodologies will have a lower WACI that is not necessarily attributable to being more sustainable. And as we have noted, changes to the WACI year over year are not necessarily because of improved efficiency or the inclusion of more sustainable companies. We struggle with this, as the strategies that we manage have a high WACI compared to our benchmark, as seen in chart 4. As we have said before, the continued focus of the industry on lowering carbon intensity sets some investment policies up to drive capital away from the very sectors where environmental investment is most needed.
Chart #4: Weighted Carbon Intensity (WACI) of Greenchip vs Benchmark
Why it matters
So, what does this all mean and why is it important for you to know? The current methods of reporting key carbon metrics make it very challenging to compare companies with each other, with a broader industry or across a portfolio. At Greenchip, our focus is on allocating capital to the industries and companies that we believe will have the greatest impact and generate superior returns. While we pay attention to widely used metrics, we will go much deeper to understand companies and evaluate them in a way that better informs us of their impact and enables us to make better decisions for the strategies that we manage. We don’t have an answer for the best way to quickly evaluate companies from a carbon perspective, but we advocate for global disclosure standardization and increased climate-metric literacy to support more effective investment in a transition to a more sustainable world.
1 Source: https://phys.org/news/2022-09-fertilizers-global-emissions.html
Source for charts 1 and 2: company sustainability reports and CDP questionnaires.
Issued by Mackenzie Financial Corporation (“Mackenzie Investments”). For institutional use only. This material is provided for marketing and informational purposes only and does not constitute investment advice or an offer of investment products or services (or an invitation to make such an offer). Certain information contained in this document is obtained from third parties.
Mackenzie Investments believes such information to be accurate and reliable as at the date hereof, however, we cannot guarantee that it is accurate or complete or current at all times. The information provided is subject to change without notice and Mackenzie Investments cannot be held liable for any loss arising from any use of or reliance on the information contained in this document. No portion of this communication may be reproduced or distributed to anyone without the express permission of Mackenzie Investments. Examples related to specific securities are not intended to constitute investment advice or any form of recommendation in relation to those securities.
This material contains forward-looking statements which reflect our current expectations or forecasts of future events. Forward-looking statements are inherently subject to, among other things, risks, uncertainties and assumptions which could cause actual events, results, performance or prospects to differ materially from those expressed in, or implied by, these forward-looking statements. Please do not place undue reliance on forward-looking statements.