

How inflation changes the traditional 60/40 allocation

About the author

About the author

About the author

About the author

About the author
IN THIS ARTICLE
Highlights
The portfolio legacy of a low-inflation era
For much of the three decades leading up to the pandemic, the 60/40 portfolio did much of what investors wanted. Equities supplied growth; while bonds provided income and a cushion when equity markets faltered. The macroeconomic backdrop was unusually supportive. Inflation remained subdued, globalization expanded, and declining bond yields reinforced returns across both fixed income and long-duration growth equities.
After three decades, these conditions became embedded in both investor expectations and portfolio construction. Ray Dalio, founder of one of the world’s largest hedge funds, has put the tendency simply: “People tend to extrapolate what they have gotten used to.” 1 Portfolios built during this period naturally came to favour many of the assets that benefited most from it, including long-duration bonds and growth-oriented equities.
The post-2022 experience is a useful reminder that the relationships supporting a balanced portfolio can change. As illustrated in figure 1, a US 60/40 portfolio generated a 12.8% annualized return with 7.2% volatility over 2011-2021, when average stock-bond correlation was -0.09. In the more recent period shown, annualized return was 9.4%, volatility was 8.8% and average correlation had become positive, at +0.05.
The comparison covers relatively short and unequal periods, so it should not be read as evidence that the stock-bond relationship has changed permanently. It does show that the negative correlation investors became accustomed to is not a constant. When stocks and bonds move together, the bond allocation provides less of the cushion that made the traditional mix so effective through much of the previous period.
Figure 1: Comparing 60/40 return, volatility and stock-bond correlation across pre- and post-2022 market environments
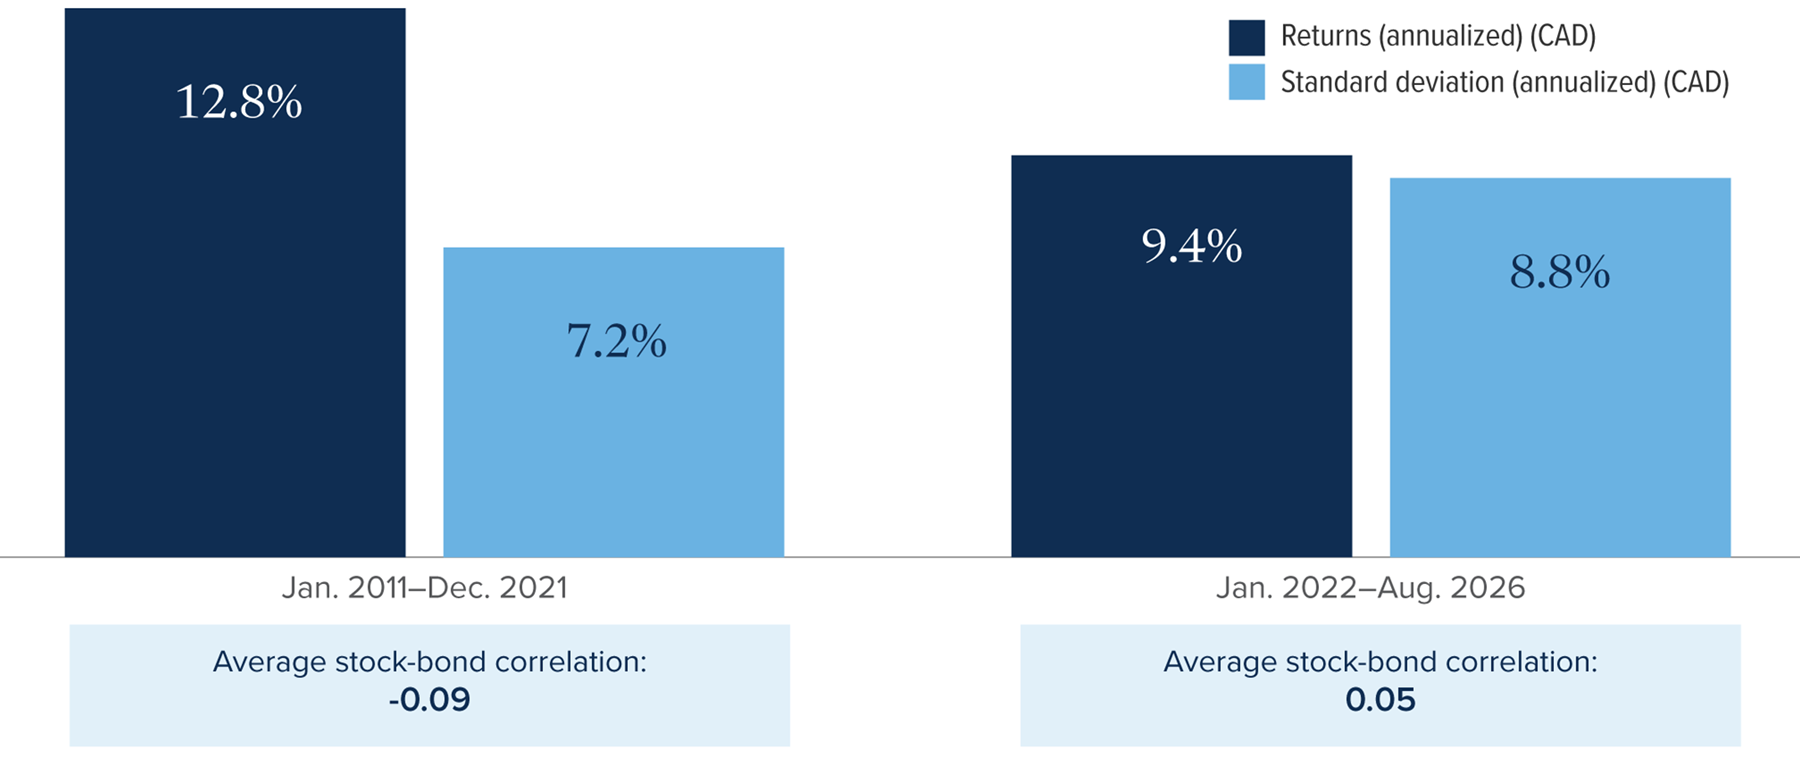
Source: Morningstar Direct, Mackenzie Investments. 60/40 portfolio comprises 60% S&P 500 Total Return Index and 40% Bloomberg U.S. Treasury Total Return Index, rebalanced monthly. Returns are in CAD. Annualized return and volatility are calculated from monthly returns. Average stock-bond correlation is the average of 36-month rolling correlations between the monthly CAD returns of the S&P 500 Total Return Index and Bloomberg U.S. Treasury Total Return Index.
A shifting inflation regime
This change in stock-bond behaviour has unfolded alongside a broader shift in the macroeconomic backdrop. For much of the globalization era, growing access to lower-cost production and increasingly efficient supply chains helped contain goods inflation.
Figure 2: Globalization dampened U.S. goods inflation
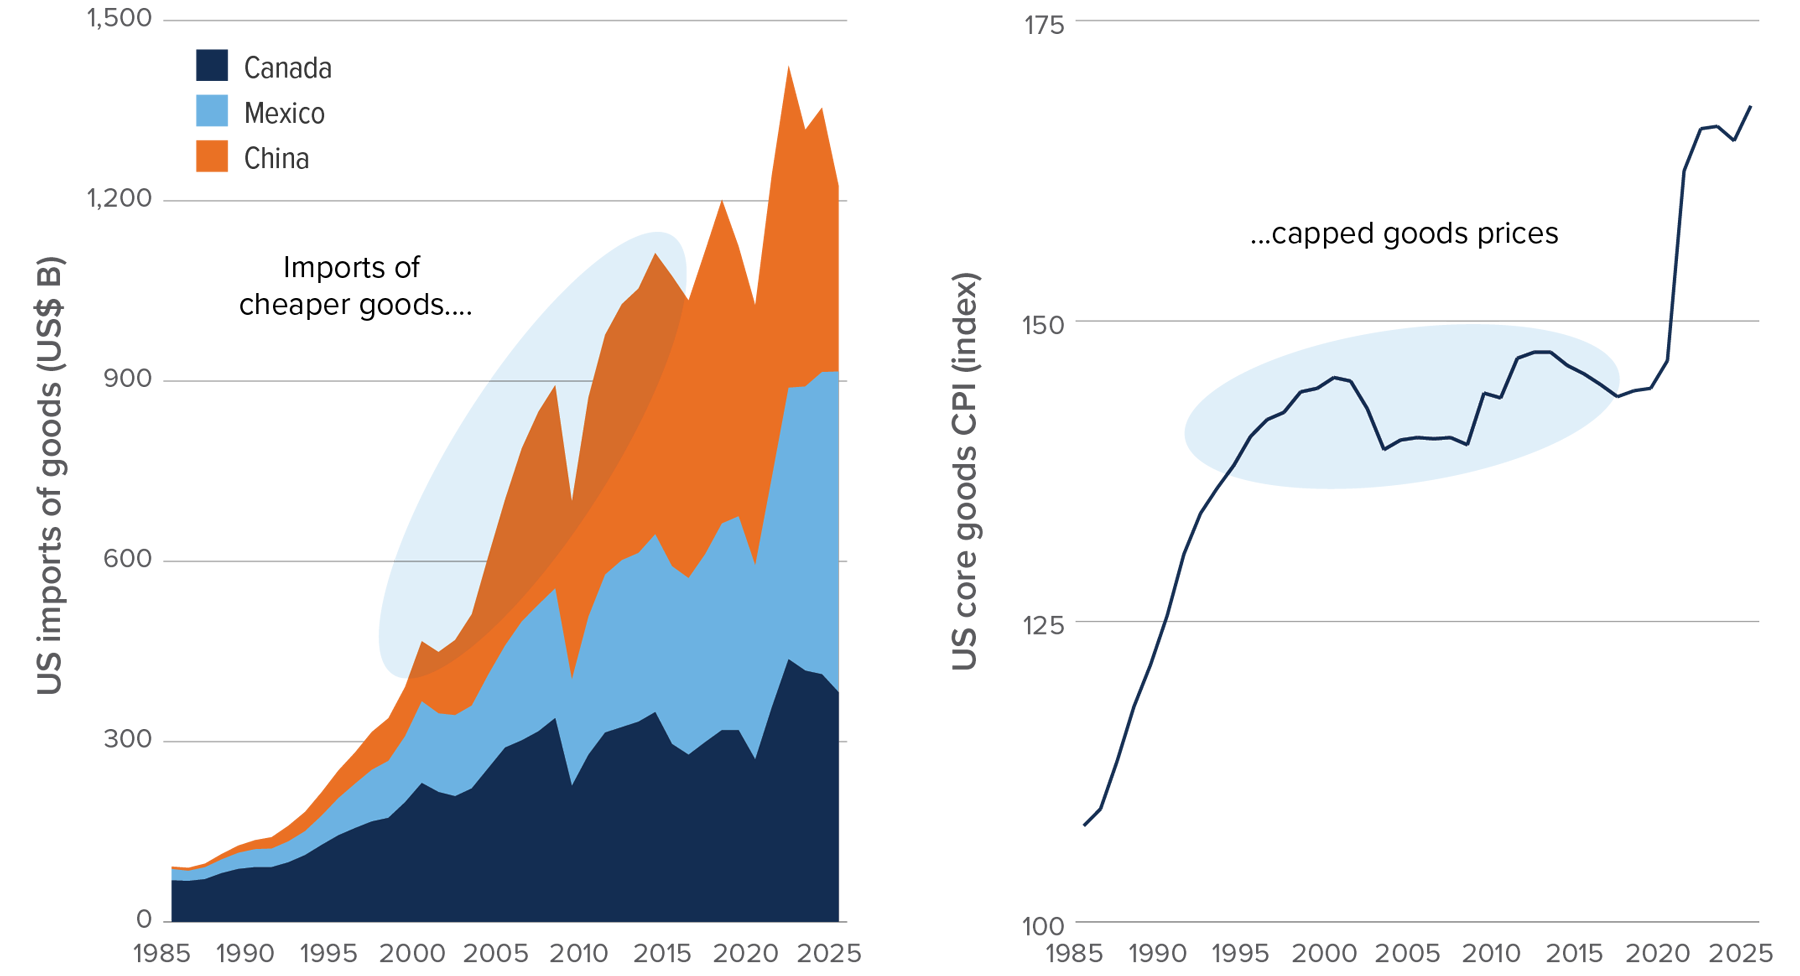 Source: Mackenzie Investments estimates.
That backdrop is changing. Global trade is becoming more fragmented as countries place greater emphasis on economic and energy security, reshoring and control over critical supply chains. Sourcing decisions are increasingly shaped not just by cost, but by the reliability of trading partners and the resilience of supply and transport routes. That can mean accepting higher costs in exchange for greater security of supply, eroding some of the inflation-dampening effects associated with decades of globalization. Governments are also investing more heavily in domestic manufacturing and infrastructure. A more fragmented global economy may also leave inflation more vulnerable to periodic supply-side shocks.
Regardless of where inflation ultimately settles, its path is unlikely to be linear. It will still move through periods of acceleration and deceleration, and those shifts can materially alter the relative performance of different asset classes.
What sits inside the 60 and the 40 matters
The level of inflation tells only part of the story. Inflation at 4% after rising from 3% creates a fundamentally different investment environment than inflation at 4% after falling from 5%. The destination is identical; the direction is not.
That difference can materially affect the relative performance of assets held within both equities and fixed income. A 60/40 allocation describes the split between the two, but says little about how those exposures are positioned for a given inflation regime.
When inflation is rising, value and resource equities, inflation-linked securities and commodities may may benefit relative to other asset classes, while long-duration nominal bonds can face greater pressure. As inflation begins to decline, duration can become more useful again, while relative opportunities across equity styles may also shift.
Within fixed income, emerging-market debt can further broaden the opportunity set. Starting yields remain attractive across many EM markets, while differences in inflation, policy and currency cycles can provide a meaningful source of diversification relative to developed-market bonds. Real yields also remain elevated in parts of the asset class, although the opportunity is highly differentiated across countries and requires selectivity.
Making room for the physical economy
Commodities are distinctive because they are not simply affected by inflation; they are often part of the inflation process itself. Energy, metals and agricultural inputs feed directly into the cost base of the economy. When their prices rise, exposure to the physical inputs driving inflation can behave very differently from a portfolio composed primarily of financial assets. As a result, commodities have historically served as a ballast in portfolios during rising inflationary regimes, as shown in Figure 3 below.
Resource equities provide another link to the physical economy. They are not interchangeable with commodity exposure, as company valuations, operating costs, balance sheets and management decisions matter, but their earnings are tied more directly to the production of energy and materials than those of most broad-market equities. Exposure to the physical economy can therefore introduce return drivers linked to commodities and resource production into portfolios that may otherwise be dominated by financial assets.
Figure 3: The ballast in your portfolio during rising inflationary regimes

Source: Mackenzie Investments. Indices: iShares MSCI World ETF, SPDR S&P 500 ETF Trust, iShares Core 10+ Year USD Bond ETF, iShares S&P GSCI Commodity-Indexed Trust, SPDR Gold Shares.
Time period: 1962–2025. Returns annualized and in CAD. Regimes minimum of three months.
If inflation proves more persistent than it was during the pre-pandemic period, should fixed income alone continue to bear the full burden of portfolio diversification, particularly when stocks and bonds become positively correlated? A broader opportunity set, including commodities and other inflation-sensitive assets, may provide additional return drivers beyond traditional stocks and bonds.
The precise weights of the “new 60/40” are less important than the broader question of whether a more persistent inflation backdrop could call for a wider set of return drivers than traditional stocks and bonds alone. This reinforces the case for an approach that can tactically adjust the asset mix as inflation regimes change, rather than remaining anchored to a static mix.
A tactical approach to the full inflation cycle
The Mackenzie Tactical Asset Allocation Fund is designed to respond tactically as the inflation regime evolves, rather than to predict the path of inflation. As renowned value investor and author Howard Marks wrote in a 2001 memo, “In my opinion, the key to dealing with the future lies in knowing where you are, even if you can’t know precisely where you’re going.” 2
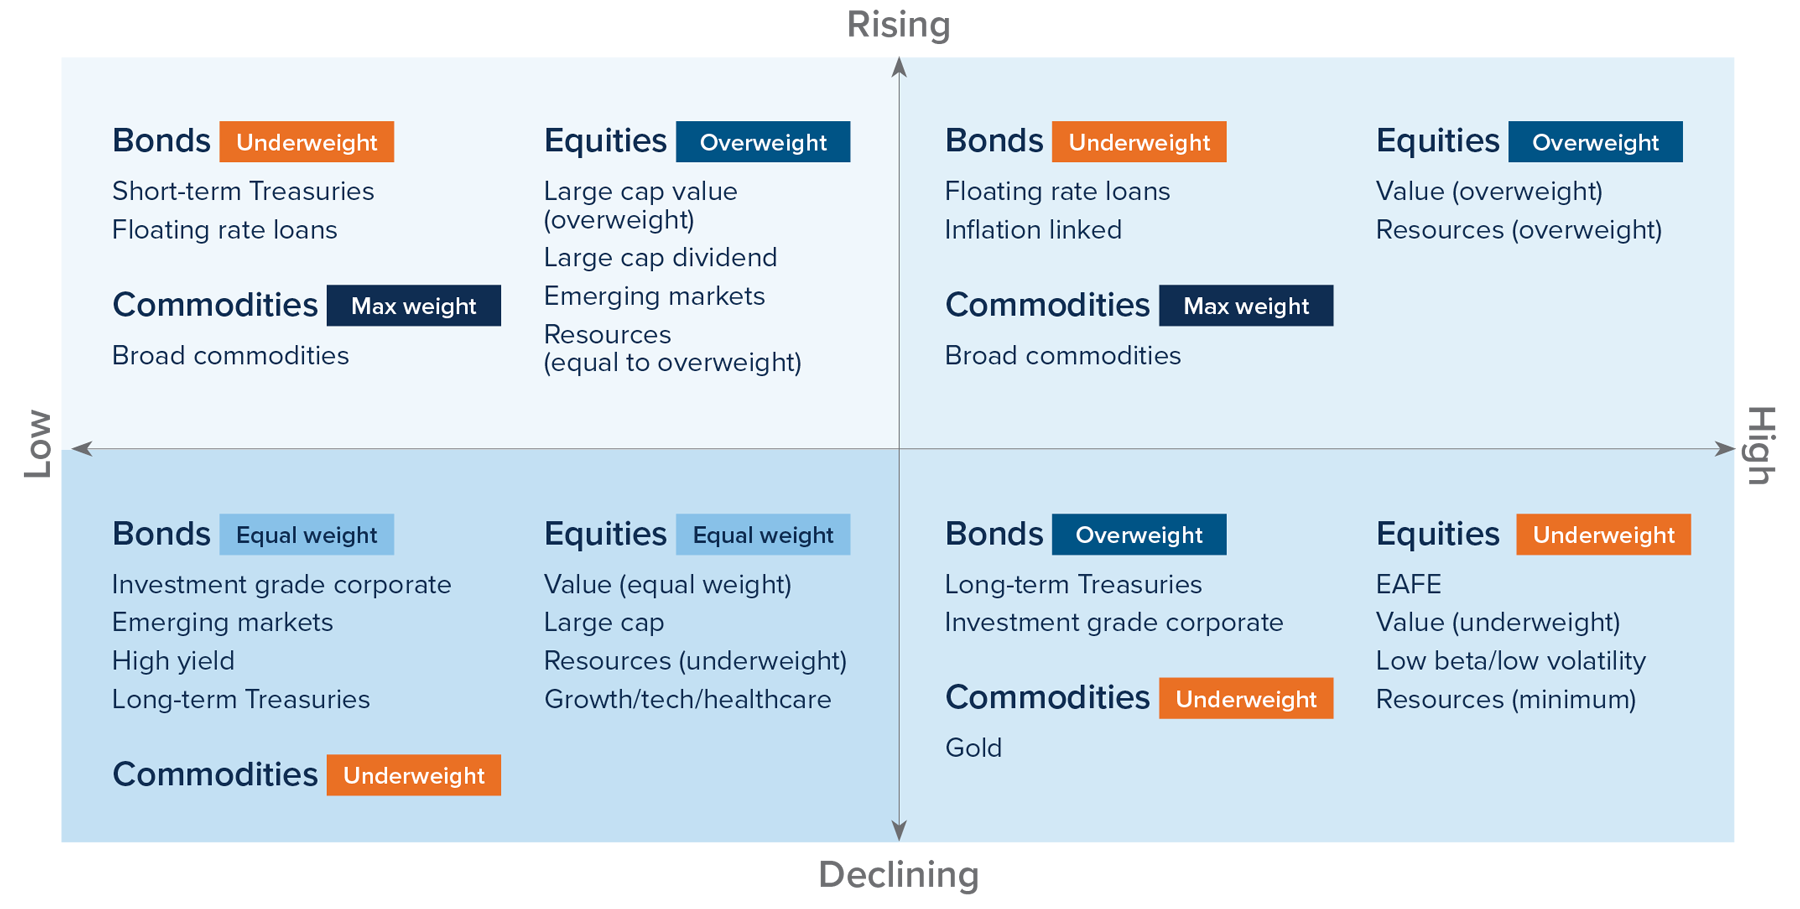
The Fund's proprietary framework evaluates both the level and direction of U.S. headline CPI, classifying the environment into four distinct inflation regimes. These signals inform, rather than dictate, portfolio positioning alongside fundamental research and portfolio manager judgment.
Equity exposure generally ranges from 40% to 60%, with dedicated ranges for resource, precious- metals and value equities. The fund can also allocate directly to commodities. Fixed income exposure ranges from 40% to 60%, with allocations across government and investment-grade corporate bonds, EM debt, inflation-linked securities and floating-rate debt.
Together, these exposures give the investment team multiple ways to express its view of the prevailing inflation regime within a single portfolio. For advisors, this creates a managed solution spanning traditional and inflation-sensitive assets, while maintaining a low to medium risk rating.
The goal is not to predict inflation perfectly, but to remain flexible as the investment environment evolves. When inflation can change both asset-class leadership and the relationship between stocks and bonds, the ability to adapt may matter as much as the starting asset mix.
Figure 4 – Different inflation regimes favour different asset classes

Sources:
1. Ray Dalio, “Diversifying well is the most important thing you need to do in order to invest well,” August 2019.
2. Howard Marks, “You can’t predict. You can prepare.” Oaktree Capital Management, November 20, 2001.
For advisor use only. No portion of this communication may be reproduced or distributed to the public as it does not comply with investor sales communication rules. Mackenzie disclaims any responsibility for any advisor sharing this with investors.
Commissions, trailing commissions, management fees and expenses all may be associated with mutual fund investments. Please read the prospectus before investing. Mutual funds are not guaranteed, their values change frequently and past performance may not be repeated. The content of this article (including facts, views, opinions, recommendations, descriptions of or references to, products or securities) is not to be used or construed as investment advice, as an offer to sell or the solicitation of an offer to buy, or an endorsement, recommendation or sponsorship of any entity or security cited. Although we endeavour to ensure its accuracy and completeness, we assume no responsibility for any reliance upon it.
This document may contain forward-looking information which reflect our or third party current expectations or forecasts of future events. Forward-looking information is inherently subject to, among other things, risks, uncertainties and assumptions that could cause actual results to differ materially from those expressed herein. These risks, uncertainties and assumptions include, without limitation, general economic, political and market factors, interest and foreign exchange rates, the volatility of equity and capital markets, business competition, technological change, changes in government regulations, changes in tax laws, unexpected judicial or regulatory proceedings and catastrophic events. Please consider these and other factors carefully and not place undue reliance on forward-looking information. The forward-looking information contained herein is current only as of October 1, 2026 There should be no expectation that such information will in all circumstances be updated, supplemented or revised whether as a result of new information, changing circumstances, future events or otherwise.
Standard deviation provides a measure of the variability of returns that have occurred relative to the average return. The higher the standard deviation, the greater is the range of returns that has been experienced. Standard deviation is commonly used as a measure of risk.
©2026 Morningstar. All Rights Reserved. The information contained herein: (1) is proprietary to Morningstar and/or its content providers; (2) may not be copied or distributed; and (3) is not warranted to be accurate, complete or timely. Neither Morningstar nor its content providers are responsible for any damages or losses arising from any use of this information. Past performance is no guarantee of future results.