
Highlights
- The MAS Team shifted from underweight to overweight US equities — demonstrating active management's value through real-time repositioning.
- Three factors favour the US: stronger macro data, better valuations and positive sentiment, while Canada faces housing headwinds and debt challenges.
- The Canadian housing market remains a structural drag on growth and consumer confidence, while elevated household debt amplifies rate sensitivity.
Introduction
Over the past decade, the role of the investment advisor here in Canada has undergone a notable transformation. Traditionally centred on portfolio construction and security selection, advisory practices are increasingly shifting toward a model that emphasizes holistic financial planning, client relationships and behavioural guidance.
This evolution has been driven by a combination of factors, including rising regulatory expectations, growing product complexity and the demand for scalable business models. In this context, many advisors are turning to externally managed investment solutions (commonly referred to as “managed solutions”) to streamline portfolio management while maintaining a consistent and disciplined investment approach.
Third-party managed solutions allow advisors to delegate key investment decisions, such as asset allocation, security selection and ongoing rebalancing. This outsourcing of portfolio management can enhance efficiency, reduce operational burden and provide access to institutional-grade expertise.
From an advisor’s perspective, managed solutions can play a central role in improving both the efficiency and scalability of their practice. Managed solutions allow advisors to reduce the time and resources spent on day-to-day investment management, so they can focus on their clients’ planning needs.
Managed solutions can also introduce greater consistency across client portfolios, helping advisors deliver a more standardized investment experience while still aligning with varying client risk profiles. In addition, access to institutional-level research, disciplined investment processes and ongoing oversight can enhance the overall quality of portfolio management, potentially strengthening client trust and retention.
Taken together, these benefits support a more scalable and resilient practice model, particularly as advisors seek to grow their client base without proportionally increasing operational complexity.
At the end of the day, advisors want reassurance that a dedicated third-party manager is continuously monitoring market conditions, evaluating risks and opportunities and making deliberate, well-informed adjustments. This ongoing oversight provides a sense of comfort that the portfolio is evolving in response to changing dynamics, rather than remaining static, and that every decision is grounded in a disciplined, proactive investment approach.
Mackenzie Investments has dedicated significant resources to managed solutions, with tailored platforms managed by the Multi-Asset Solutions (MAS) Team. What follows is a review of the active decision related to key country weights (specifically, US and Canadian equity weights) across managed solutions that the MAS Team manages.
Change in positioning:
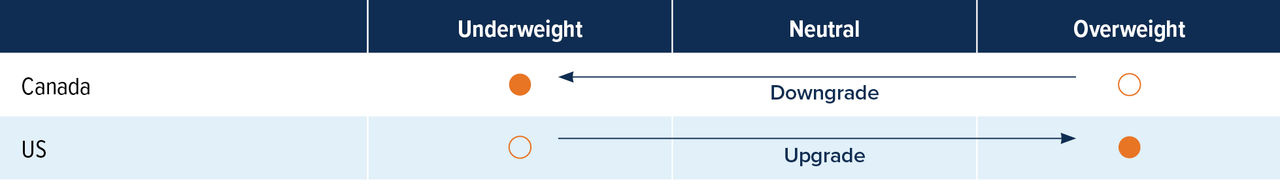
Figure 1 shows the tactical shift in country allocation of a representative portfolio (the Mackenzie All-Equity ETF Portfolio), managed by the MAS Team, from November 2025 to March 2026. In November, the portfolio was positioned with an underweight to US equities and an offsetting overweight to Canadian equities. However, over the following months, the team reversed this stance, implementing a notable change that resulted in a flip to an overweight in US equities and an underweight in Canadian equities by March 2026.
Multi-Asset Strategies Team’s Relative Equity Views
November 2025 to March 2026
Rationale for the change:
The MAS Team employs a series of proprietary quantitative models in its work. Quantitative models provide a disciplined, repeatable framework that reduces emotional bias and ensures consistency in decision-making. They can process large amounts of data efficiently, uncovering patterns and relationships that may not be apparent through qualitative judgment alone. This leads to more objective, evidence-based decisions that can be tested, refined and improved over time.
The basis for the change in country allocation across our managed solutions platforms is a proprietary multi-factor model. A multi-factor model improves tactical asset allocation by combining diverse signals (in our case, macroeconomic conditions, valuation metrics and investor sentiment), capturing different drivers of asset returns that no single factor can fully explain. This diversification of inputs helps reduce reliance on any one indicator and can make decisions that are more robust across varying market regimes. Macroeconomic factors provide context on the business cycle; valuation gauges relative attractiveness; and sentiment captures behavioural extremes that often precede reversals. Together, they enhance the consistency and risk-awareness of allocation decisions compared to single-factor or discretionary approaches.
With respect to the specific rationale for why we decided to move our US equity weight from an underweight to an overweight, the decision was based on the following.
Macro: this category of indicators has had the greatest impact in tilting our tactical asset allocation in favour of US equities. On a relative basis, recent US economic indicators, such as stronger job growth, resilient consumer spending and firmer GDP trends, have outperformed Canada’s, where higher household debt and sensitivity to interest rates have weighed more heavily on growth. Perhaps that shouldn’t be surprising, given Canada’s greater exposure to rate hikes through its housing market and variable-rate borrowing, while the US benefits from a larger, more diversified economy and stronger fiscal momentum.
Figure 2 shows recent top-line economic growth and near-term growth expectations for both the US and Canada, and it points to a large outperformance in favour of the US.
2026 GDP Growth Forecasts (%)
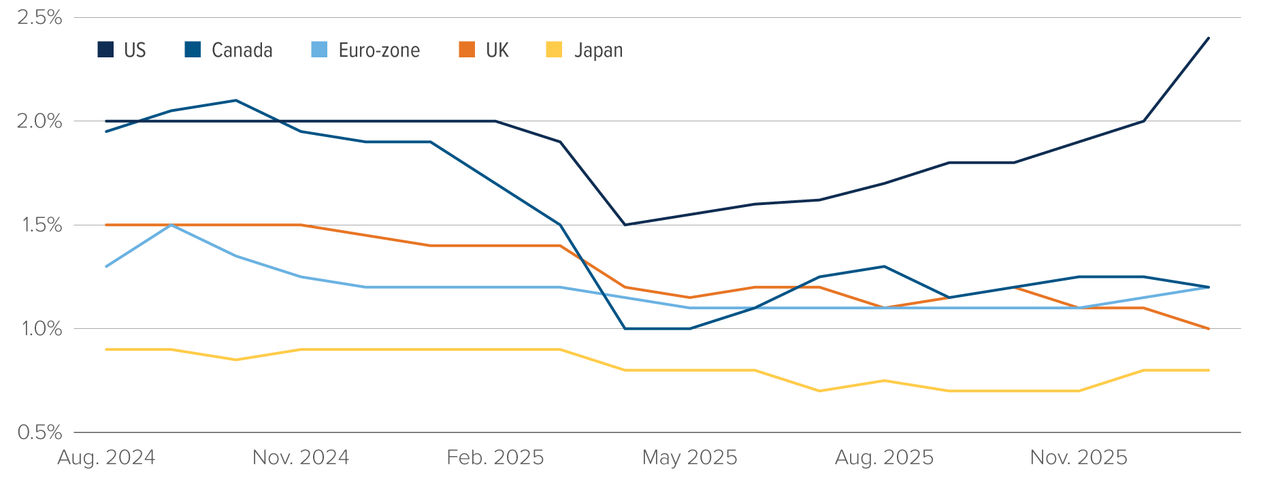
Figure 2
Source: Scotiabank GBM Portfolio Strategy, Bloomberg.
This stronger economic growth translates into better employment conditions in the US. Figures 3a) and b) provide a longer-term picture of labour conditions, as represented by the unemployment rate, in each country.
U.S. Unemployment Rate (%)
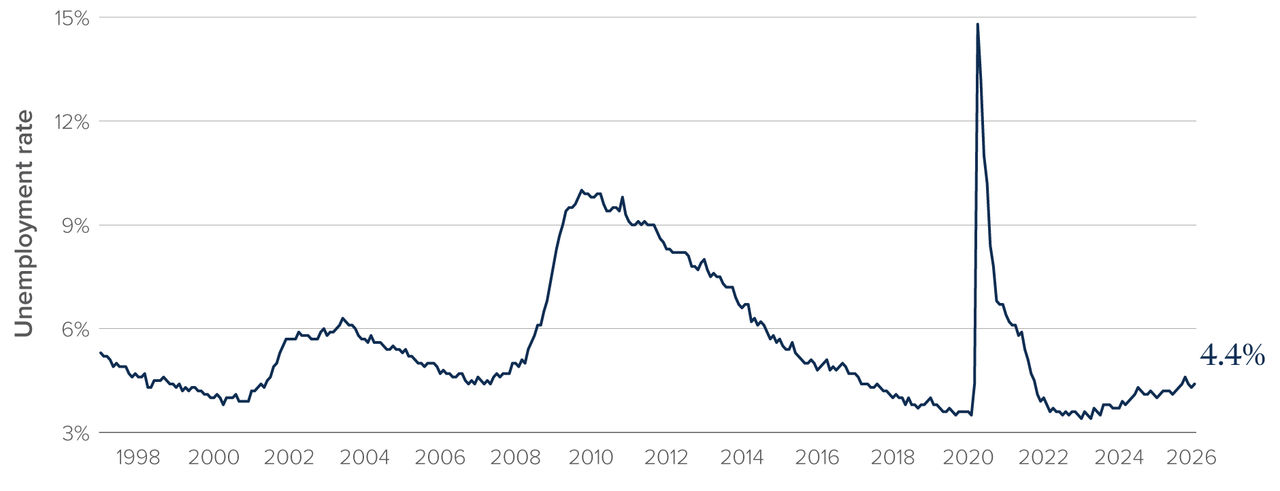
Source: Bloomberg
Canada Unemployment Rate (%)
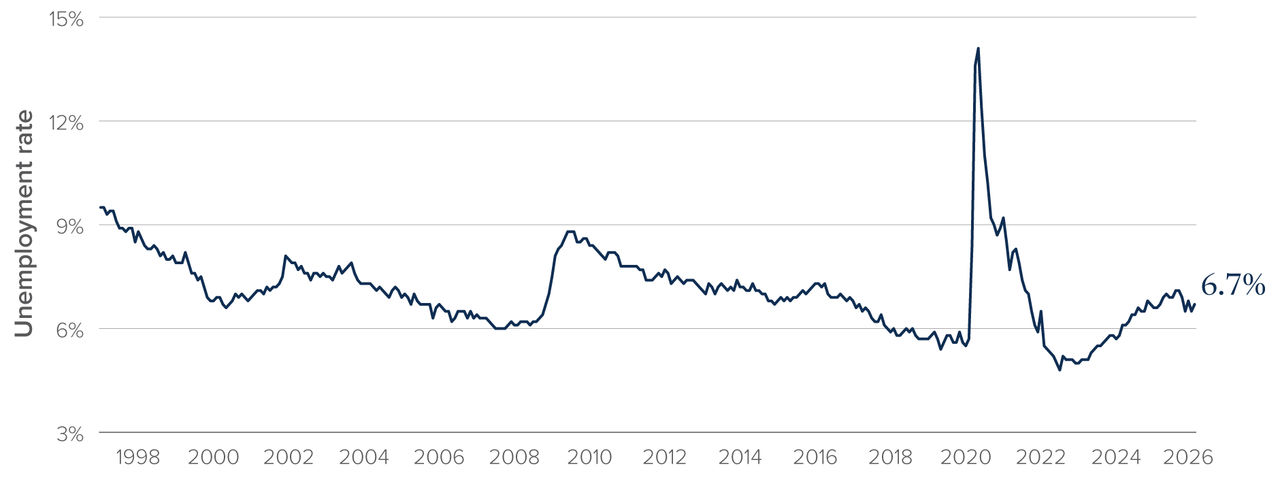
Figure 3 b)
Source: Bloomberg
It is evident from these charts that US employment conditions have been much healthier than Canada. Presumably recent weakness in the Canadian jobs market relates to a high degree of uncertainty around trade policy with the US. Canadian employers are reluctant to hire workers when they do not know the extent to which Canada will be affected by changes to this trade relationship.
One factor that is unique to Canada is housing. Housing has been a structural headwind for the Canadian economy over the past two years or so, and there is every reason to believe that it will continue to be a headwind for Canadian economic growth, employment growth and consumer sentiment (via the negative wealth effect). Figure 4 shows the extent of the adjustment that is underway in the Canadian housing market.
Canada Housing Market - Housing Price and Number of Sales
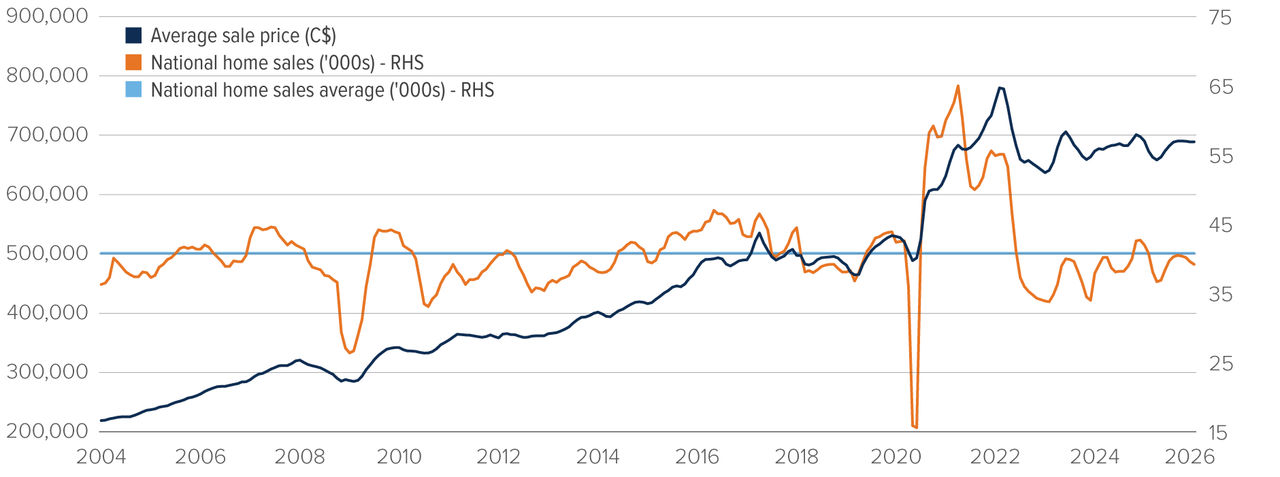
Figure 4
Source: Scotiabank GBM Portfolio Strategy, Haver Analytics.
It is evident in the chart above that much higher interest rates (to address runaway inflation through the COVID period) had a marked impact on Canadian house prices. It shows the average price of a home in Canada dropped from a high of ~$800,000 in 2022 to ~$675,000 in 2023. Meanwhile, housing sales plummeted from ~65,000 to ~40,000 per year.
While US housing has been weak, the impact has been more pronounced in Canada, reflecting structural differences between the two markets, most notably the US’s prevalence of 30-year fixed-rate mortgages versus Canada’s greater reliance on variable-rate and shorter-term (often five-year) loans. Combined with the stronger run-up in Canadian home prices over the past 10 to 15 years, this has made Canadian households more sensitive to higher interest rates and amplified the housing slowdown.
Valuation: our analysis identified that, while both the US and Canadian equity markets cannot be considered cheap, Canadian equities are relatively more overvalued now. Our analysis was done on an industry neutralized basis, meaning that we compared the valuation of, for instance, banks against banks between the countries. On that basis, we found broad evidence of better value in US sectors such as banks and technology.
It is also important to keep the composition of the two markets in mind. Figure 5 shows a side-by-side comparison of the sector weights of both the S&P 500 and S&P/TSX Composite indices.
Sector Composition: S&P 500 vs. S&P/TSX Composite (Feb 2026)
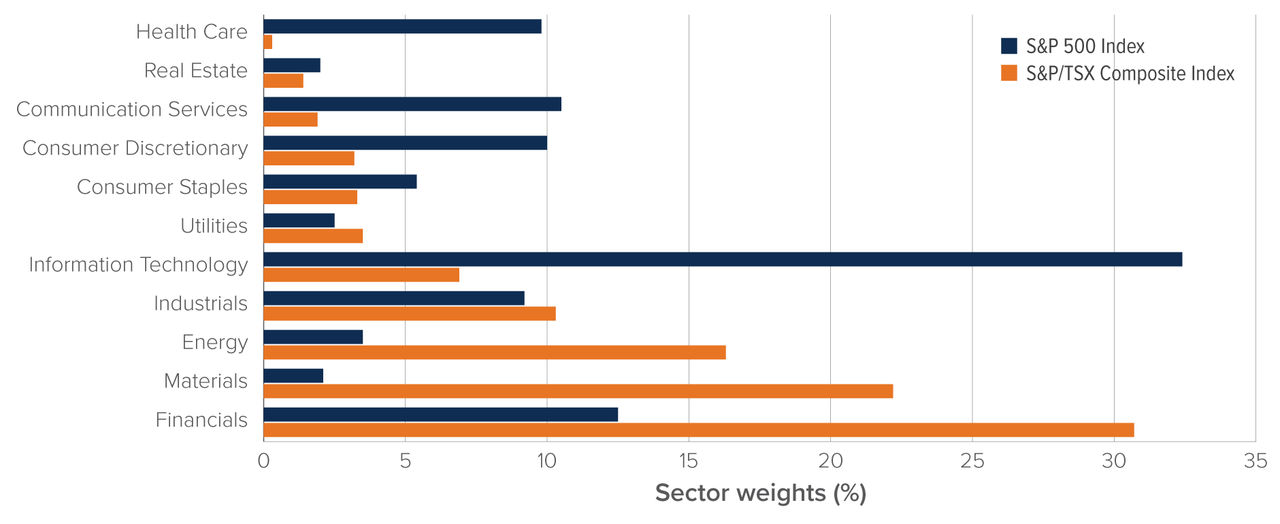
Source: Mackenzie Investments; based on S&P Dow Jones Indices data for the S&P 500 and S&P/TSX Composite, as at February 27, 2026. Sector weights based on GICS classification.
It is also worth noting the significantly higher weight of the Base and Precious Metals sector in the S&P/TSX Index. As a reminder, gold bullion and gold equities rallied sharply through 2025 and into early 2026, leaving Canadian equities particularly exposed to a potential reversal in gold prices, such as the pullback seen in recent weeks.
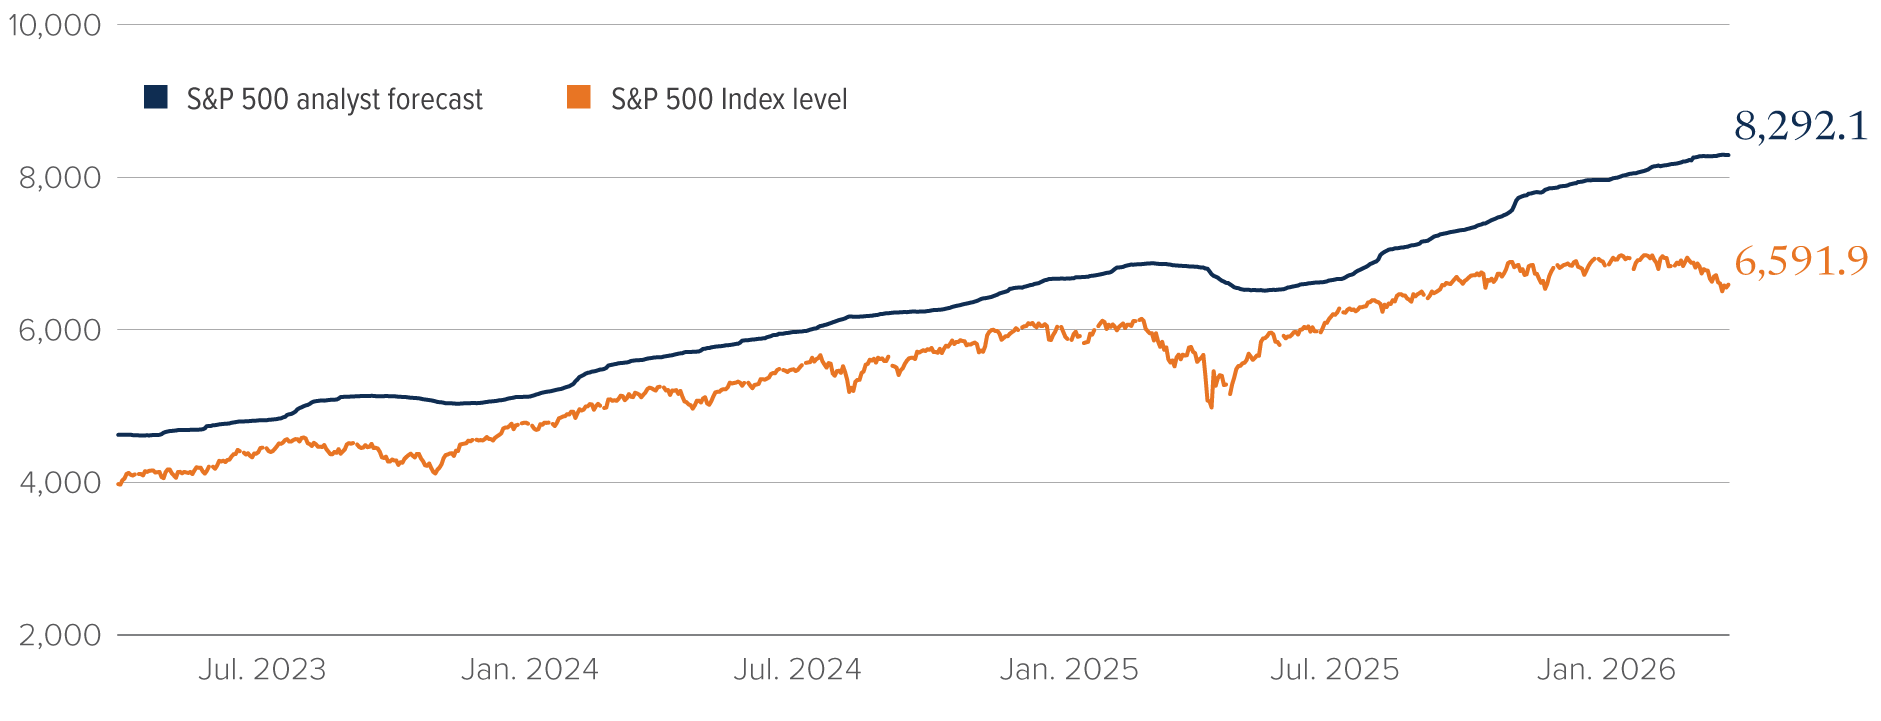
Sentiment: Figure 6 shows analyst expectations for where the S&P 500 will trade in the future, relative to where the index trades now.
United States
Canada
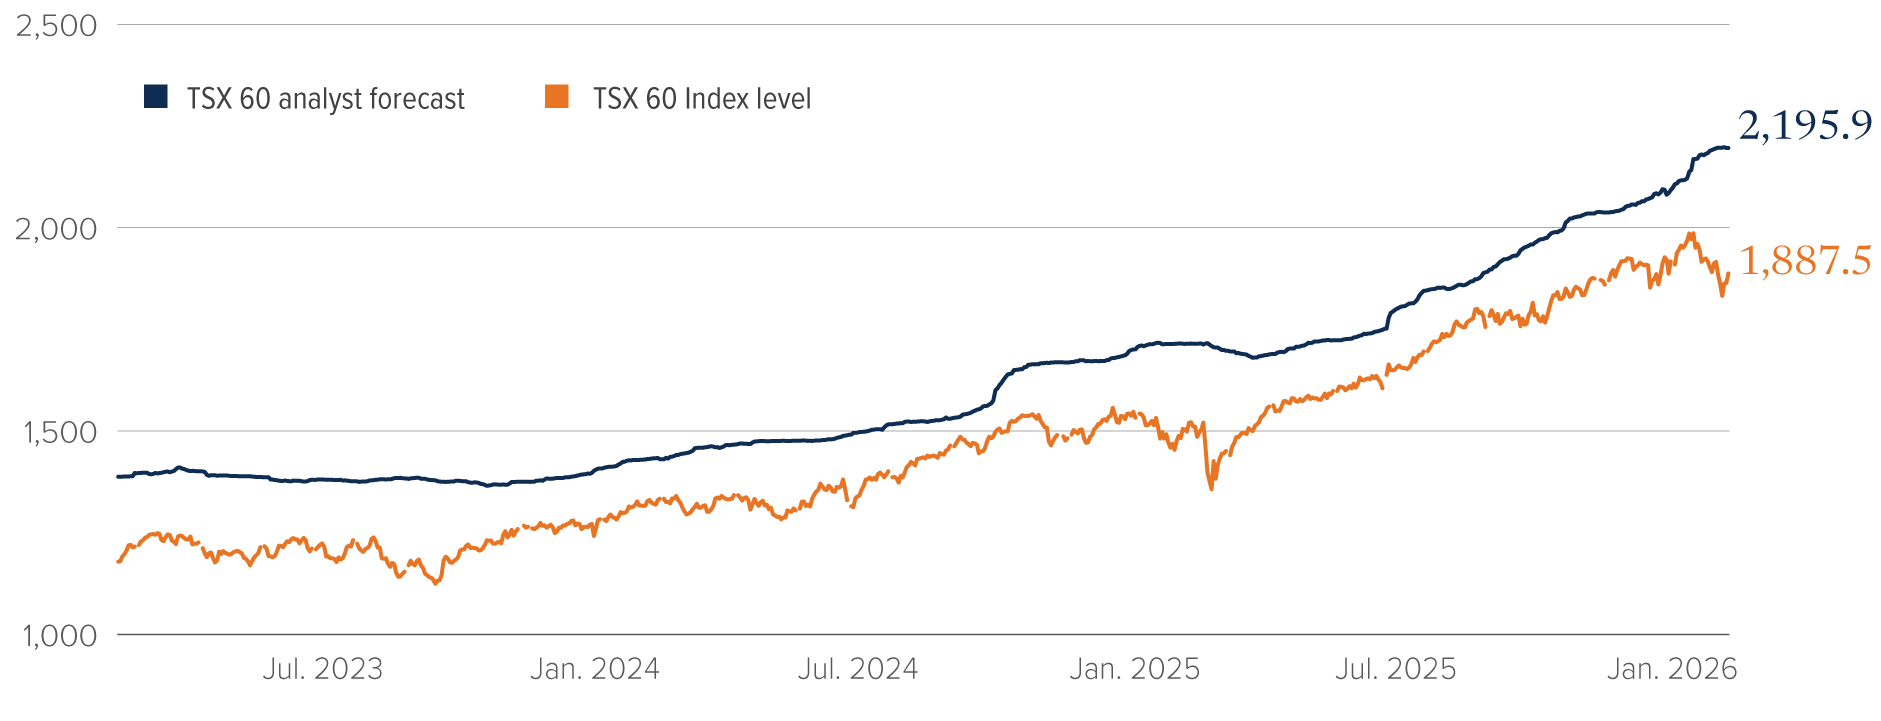
Figure 6
Source: Mackenzie Investments
The chart for the US shows that analysts expect the S&P 500 to rise from current levels (around 6,600 when this paper was prepared) to somewhere just below 8,300 (a potential rise of 23–24%). The chart for Canada shows that analysts expect the S&P/TSX60 to rise from current levels (around 1,915 when this paper was prepared) to somewhere just below 2,200 (a potential rise of 14–15%). Sentiment, as referenced in the expectations of analysts, favours US equities over Canadian equities now.
Fund flows are another indicator of investor sentiment. Figure 7 supports our view that sentiment does not favour Canada.
Annual Foreign Investors Buying/Selling of Canadian Equities (C$M)
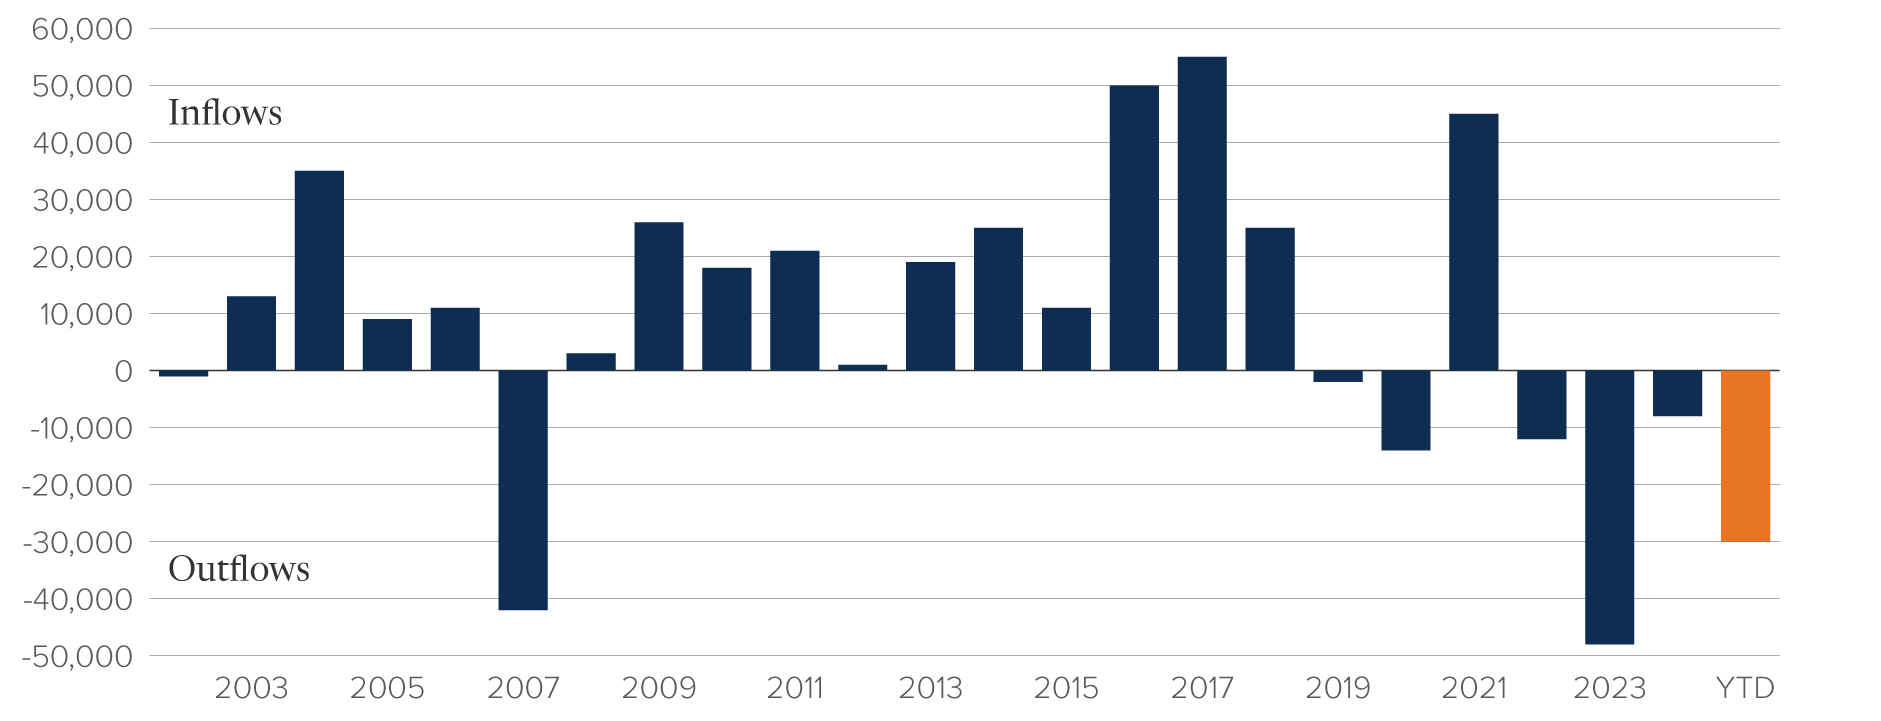
Figure 7
Source: Scotiabank GBM Portfolio Strategy; adapted from Statistics Canada, Table 36-10-0028-01 International transactions in securities, portfolio transactions in Canadian and foreign securities, by type of instrument and issuer, monthly (x 1,000,000), 10/17/25. This does not constitute an endorsement by Statistics Canada of this product.
Foreign investor purchases of Canadian securities have been negative since 2022 and that trend has accelerated thus far in 2026.
Conclusion
The allocations within Mackenzie’s managed solutions are driven by a disciplined, forward-looking investment process that integrates macroeconomic analysis, valuation signals and market sentiment. These allocations are not static. They evolve as new information becomes available and as the risk/reward profile across asset classes shifts.
The transition from an underweight position in US equities to an overweight stance, alongside a corresponding reduction in Canadian equity exposure, reflects this dynamic approach. As market conditions changed through early 2026, particularly with improving earnings expectations and more supportive macro signals in the US, the team adjusted positioning to better align with its highest-conviction opportunities.
Ultimately, the MAS Team’s active management framework is designed to ensure that client portfolios remain aligned with the most compelling opportunities globally, while maintaining a sharp focus on risk management and diversification.
Multi-Asset Strategies Team’s investment views
Tactical summary
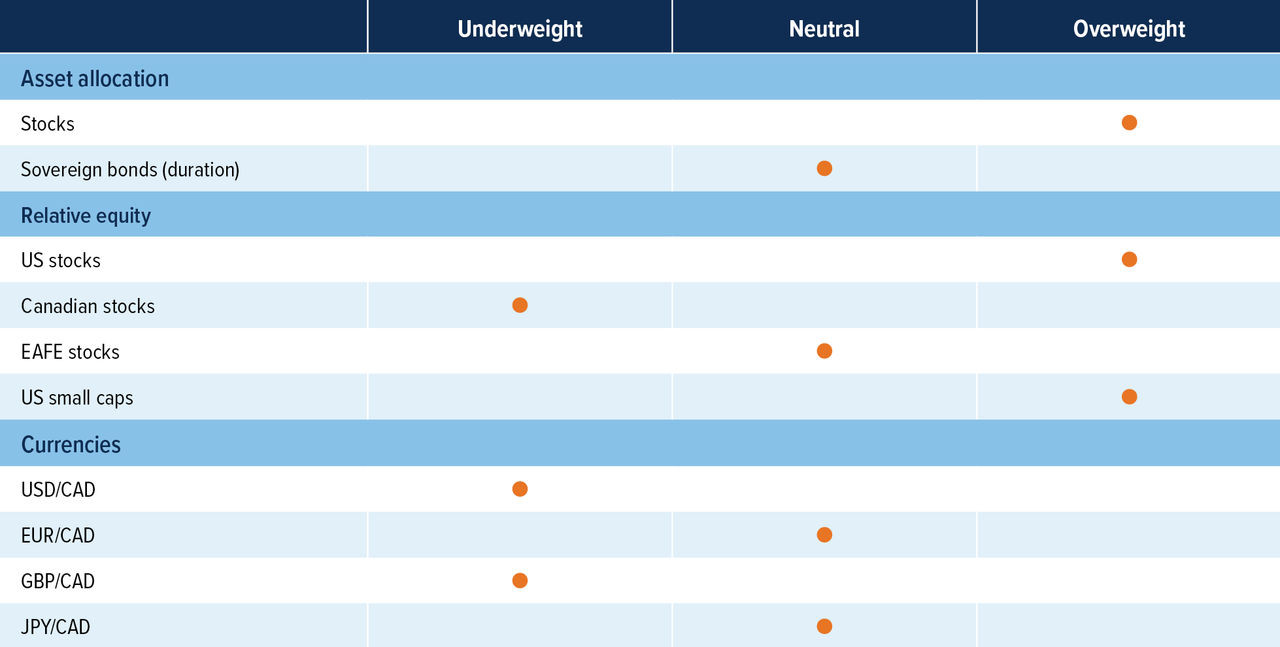
Source: Mackenzie Investments.
Note: The opinions expressed in this piece reflect short-term tactical views, which inform the positioning of some of the funds managed by the Multi-Asset Strategies Team.
Positioning highlights
Stocks remain overweight while waiting for hard data: Stock markets have declined in March as the war in Iran and uncertainty around the flow of oil in the Strait of Hormuz caused global uncertainty. Ultimately, the short-term direction of stocks will depend on the outcome of this war and how long Middle East energy infrastructure is impaired. For now, we remain overweight until there is a clear direction and measurable impact on company earnings.
Remain neutral on bonds: Bond yields rallied in March as central bank rate cuts were priced out of the markets due to higher inflation from higher oil prices as a result of the war in the Middle East. Bond yields are currently not attractive enough to go overweight.
Buy US vs. Canada equities: S&P 500 has outperformed the TSX in March despite higher oil prices as gold weighed on the TSX Composite. We remain overweight US versus Canada as the TSX remains overvalued and the Canadian economy is much weaker than the US.
Currencies: USD remains overvalued, and our long-term view is for the USD to depreciate versus most developed countries. We continue to like CAD and JPY as the best play for this view. With oil up strongly in March, it should be supportive for Canada’s economy compared to other currencies. With EUR falling in March, we switch to a neutral position from underweight versus CAD, as EUR begins to look more attractive.