
Highlights
- 2026 may represent a compelling entry point for investors to initiate or increase allocations to emerging markets equities.
- Emerging markets are far from homogeneous. The economic, demographic and policy forces shaping China’s outlook differ meaningfully from those influencing other major markets, such as India, underscoring the importance of selective exposure.
- For Canadian investors, emerging markets equities can serve as an effective portfolio diversifier, offering differentiated growth drivers and return streams relative to domestic and US markets.
Introduction
For Canadian investors, emerging market (EM) equities have long carried a dual narrative of promise and disappointment.
In the years leading up to the Global Financial Crisis, they were decidedly en vogue: rapid industrialization in China, its accession to the World Trade Organization and a powerful commodity super cycle combined to create the impression of an unstoppable growth engine across the developing world. Capital flowed eagerly into EM mutual funds and ETFs, valuations expanded and the “BRIC” thesis became a cornerstone of global asset allocation. For resource-heavy Canada, the linkage felt especially compelling, as China’s voracious demand underpinned oil and metals prices, and reinforced the case for structural outperformance.
Yet the decade and a half since 2008 has told a more sobering story. As The Economist recently put it “for much of the past 20 years the emerging markets have seemed doomed to never emerge.” Slower Chinese growth, repeated commodity busts, a persistently strong US dollar, and governance and geopolitical shocks have left EM equities as relative laggards versus US markets. Periodic rallies have been offset by volatility, policy missteps and shifting global supply chains. A new wrinkle since the re-election of Donald Trump has been the added volatility of US/China trade relationship. As 2026 begins though, Canadian investors must reassess whether this prolonged underperformance represents a structural headwind — or the foundation for renewed opportunity.
The emerging markets
The term “emerging markets” suggests a coherent asset class, yet it encompasses a strikingly diverse set of countries whose economic structures, political systems and market dynamics differ profoundly.
At one end of the spectrum sit large, systemically important economies such as China and India, each with populations exceeding one billion and domestic markets capable of driving growth independent of external demand. At the other are smaller, more externally oriented economies (such as Chile, Malaysia or Hungary) whose equity market performance can hinge on a narrow range of exports or capital flows. Commodity exporters like Brazil, South Africa and Indonesia are heavily influenced by global resource cycles, while manufacturing powerhouses such as Mexico and Vietnam are more levered to global trade and supply chain realignments.
Institutional quality and governance standards also vary widely, shaping risk premia and long-term return potential. Some markets feature deep, liquid capital markets with growing domestic investor bases; others remain dominated by state-owned enterprises or family-controlled conglomerates. Monetary credibility, fiscal flexibility and currency stability differ markedly, amplifying dispersion in both returns and volatility. Even demographic trends diverge: India and parts of Southeast Asia enjoy favourable working-age population growth, while China faces a rapidly aging society and shrinking labour force.
For Canadian investors, this lack of homogeneity has important implications. Treating emerging markets as a monolith risks obscuring both concentrated risks and differentiated opportunities. In practice, country selection, sector exposure and structural reform trajectories matter far more than the broad label suggests.
Notwithstanding the above, we will work through the balance of this paper to consider the attractiveness of an allocation to EM equities for a Canadian investor at this juncture. To jump ahead, the Multi-Asset Strategies Team at Mackenzie Investments has recently moved to an overweight position in EM equities in our portfolios.
Strong recent returns in EM equities
As mentioned, EM equity returns were strong in the period leading up to the Global Financial Crisis. Since then, EM equity returns have trailed developed markets (DM) returns and by a wide margin. See Figure 1 for a long-term perspective on EM versus DM equity returns.
MSCI EM vs. MSCI World Relative 10-Year Trailing Annualized Return by Year (2000 - 2025)
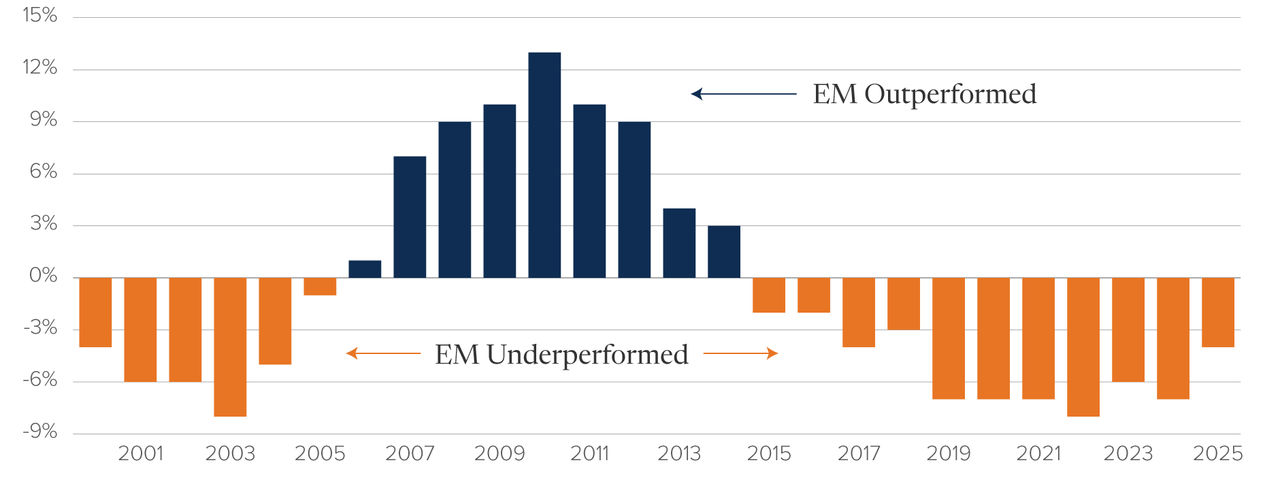
Figure 1
Source: FactSet, Mackenzie Investments.
Total return data is un US dollars from December 31, 1990 to December 31, 2025. All data points end in December.
This chart shows 10-year trailing returns for the difference between EM and DM equities. It visually demonstrates the prolonged period within which DM equities outperformed EM equities (a period that dates back more than 15 years). It is acknowledged that much of the DM equities outperformance from 2009 to 2024 was because of the outsized contribution of US growth stocks. More recently though, the tide appears to have turned. See Figure 2 below for a view of the 2025 returns for EM equities versus US equities.
2025 Price Return*
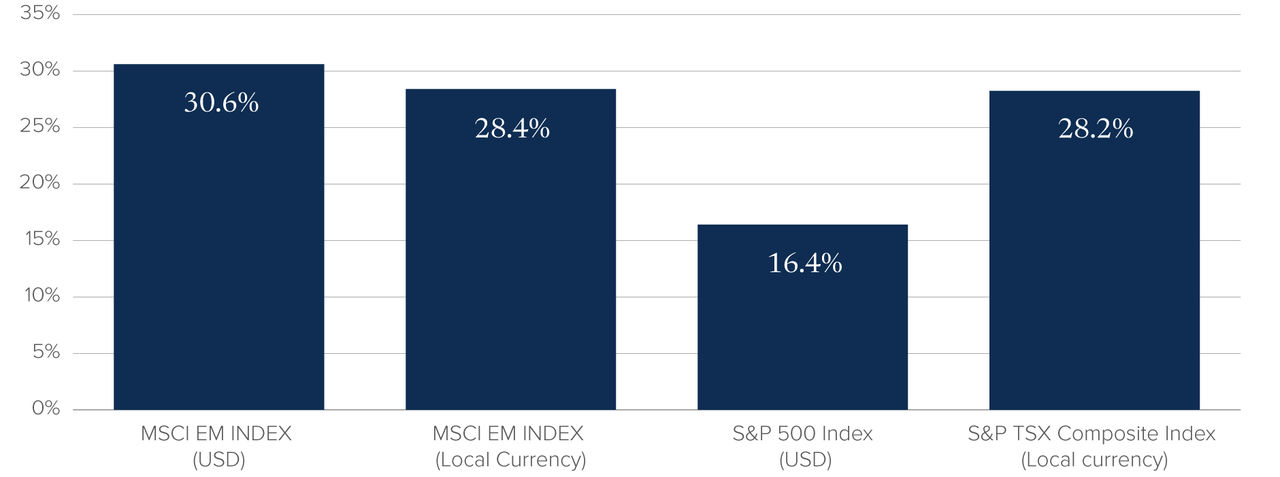
Figure 2
Source: FactSet, Mackenzie Investments
*Price return from December 31, 2024 - December 31, 2025. Past perfromance does not predict future returns.
Note that when relative EM equity returns become positive, the trend typically persists. See Figure 3.
GEM Relative to Global, USD terms (prior to 1988, HK and Singapore used as proxies)
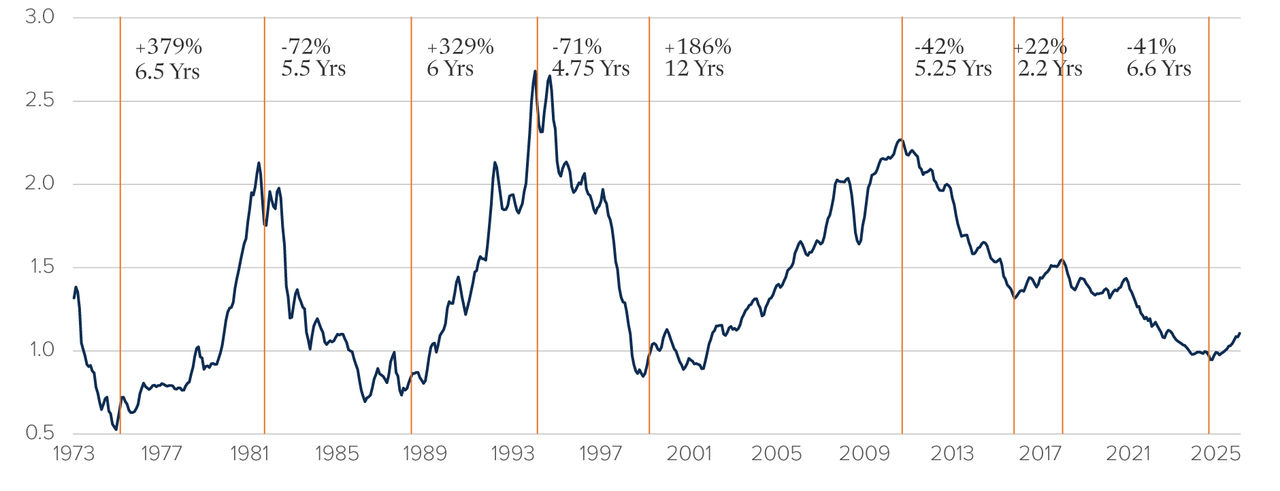
Figure 3
Source: IBES, MSCI, Datastream, UBS
As is evident in this chart, when regime change occurs it typically ushers in a prolonged period of outperformance of EM equities. Could this be one of those inflection points?
Valuations
By many measures, EM equities now represent better value than US or Canadian equities. What follows are a series of charts that illustrate the valuation advantage of EM over DM equities.
Figure 4 provides a visual comparison of forward earnings expectations for EM versus US equities.
MSCI EM and USA EPS revisions (3m % change in 12m forward EPS)
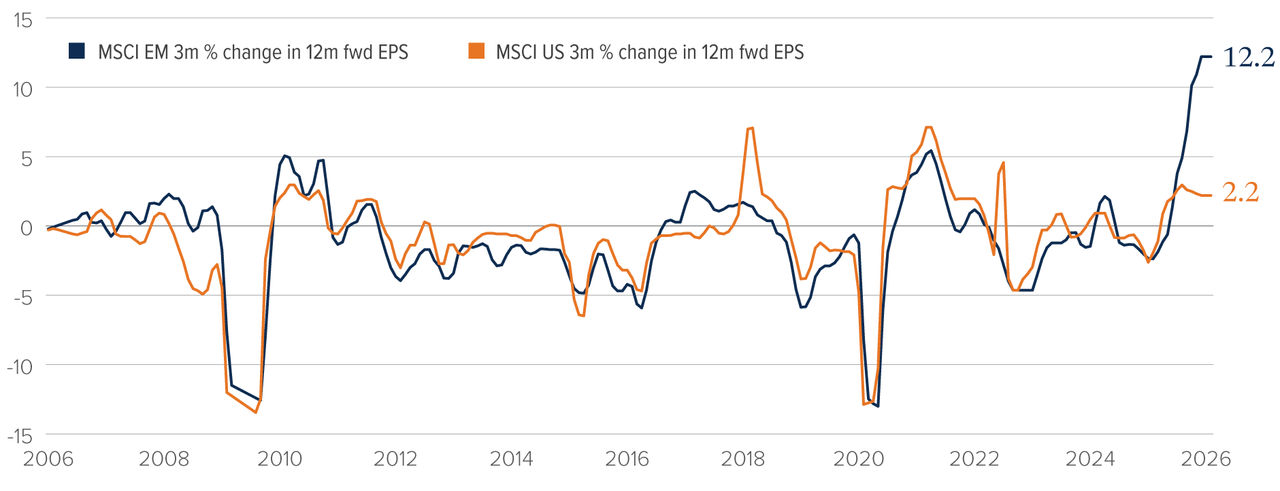
Figure 4
Source: IBES, MSCI, Datastream, UBS
See Figure 5 for a visual comparison of the PE multiple for EM equities versus MSCI World equities.
MSCI EM 12m fwd PE vs MSCI World - still a large discount by historical standards
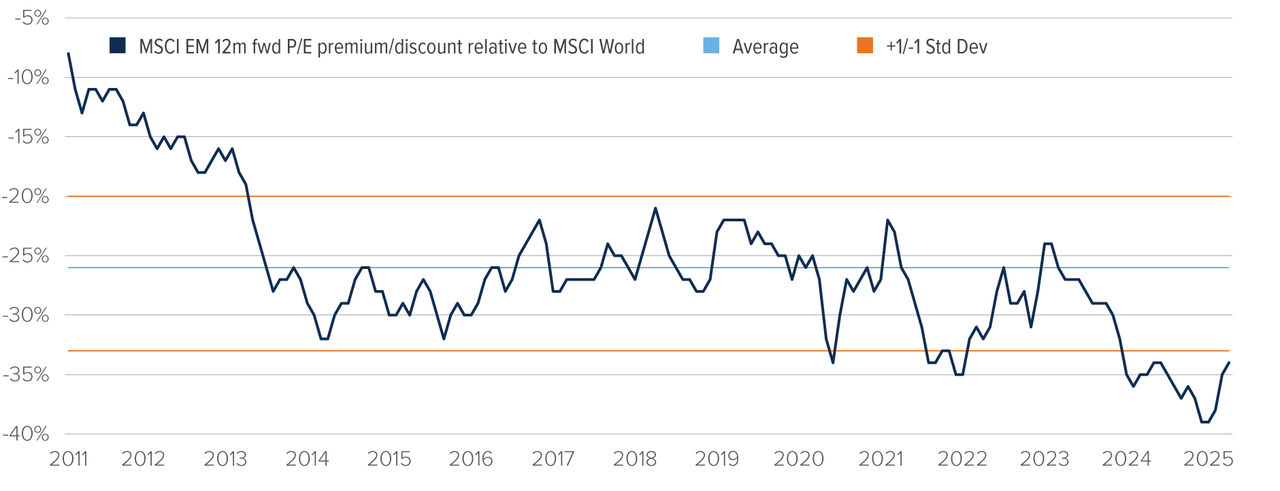
Figure 5
Source: IBES, MSCI, Datastream, UBS
See Figure 6 for a visual representation of dividend yield of EM equities versus MSCI World equities.
MSCI EM Divided yield vs MSCI World
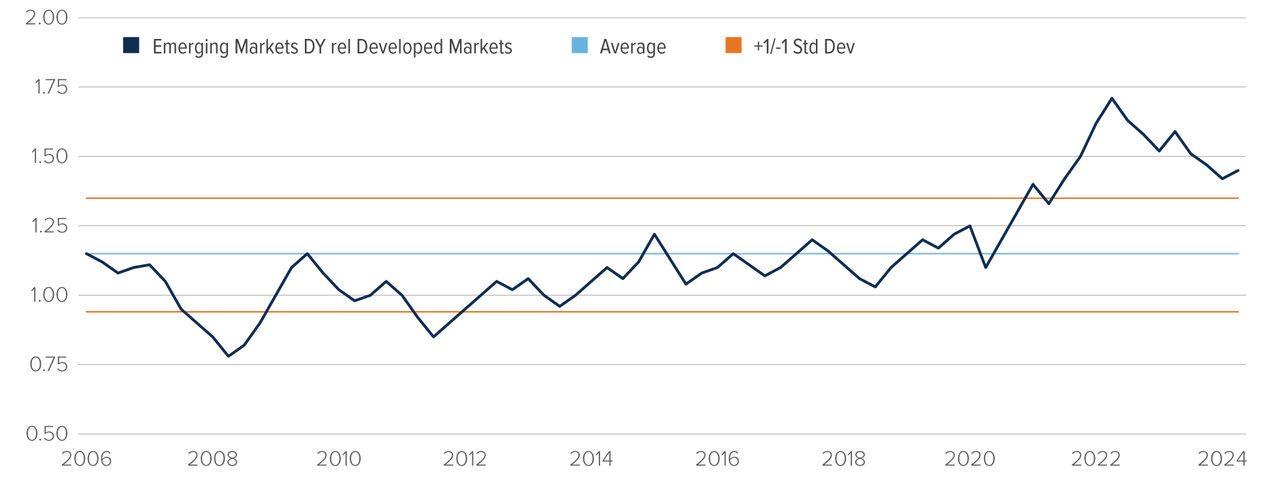
Figure 6
Source: IBES, MSCI, Datastream, UBS
Finally, Figure 7 provides a summary valuation table of various metrics across global equity markets.
Global Indices: Snapshot of Earnings & Valuations (February 5, 2026)
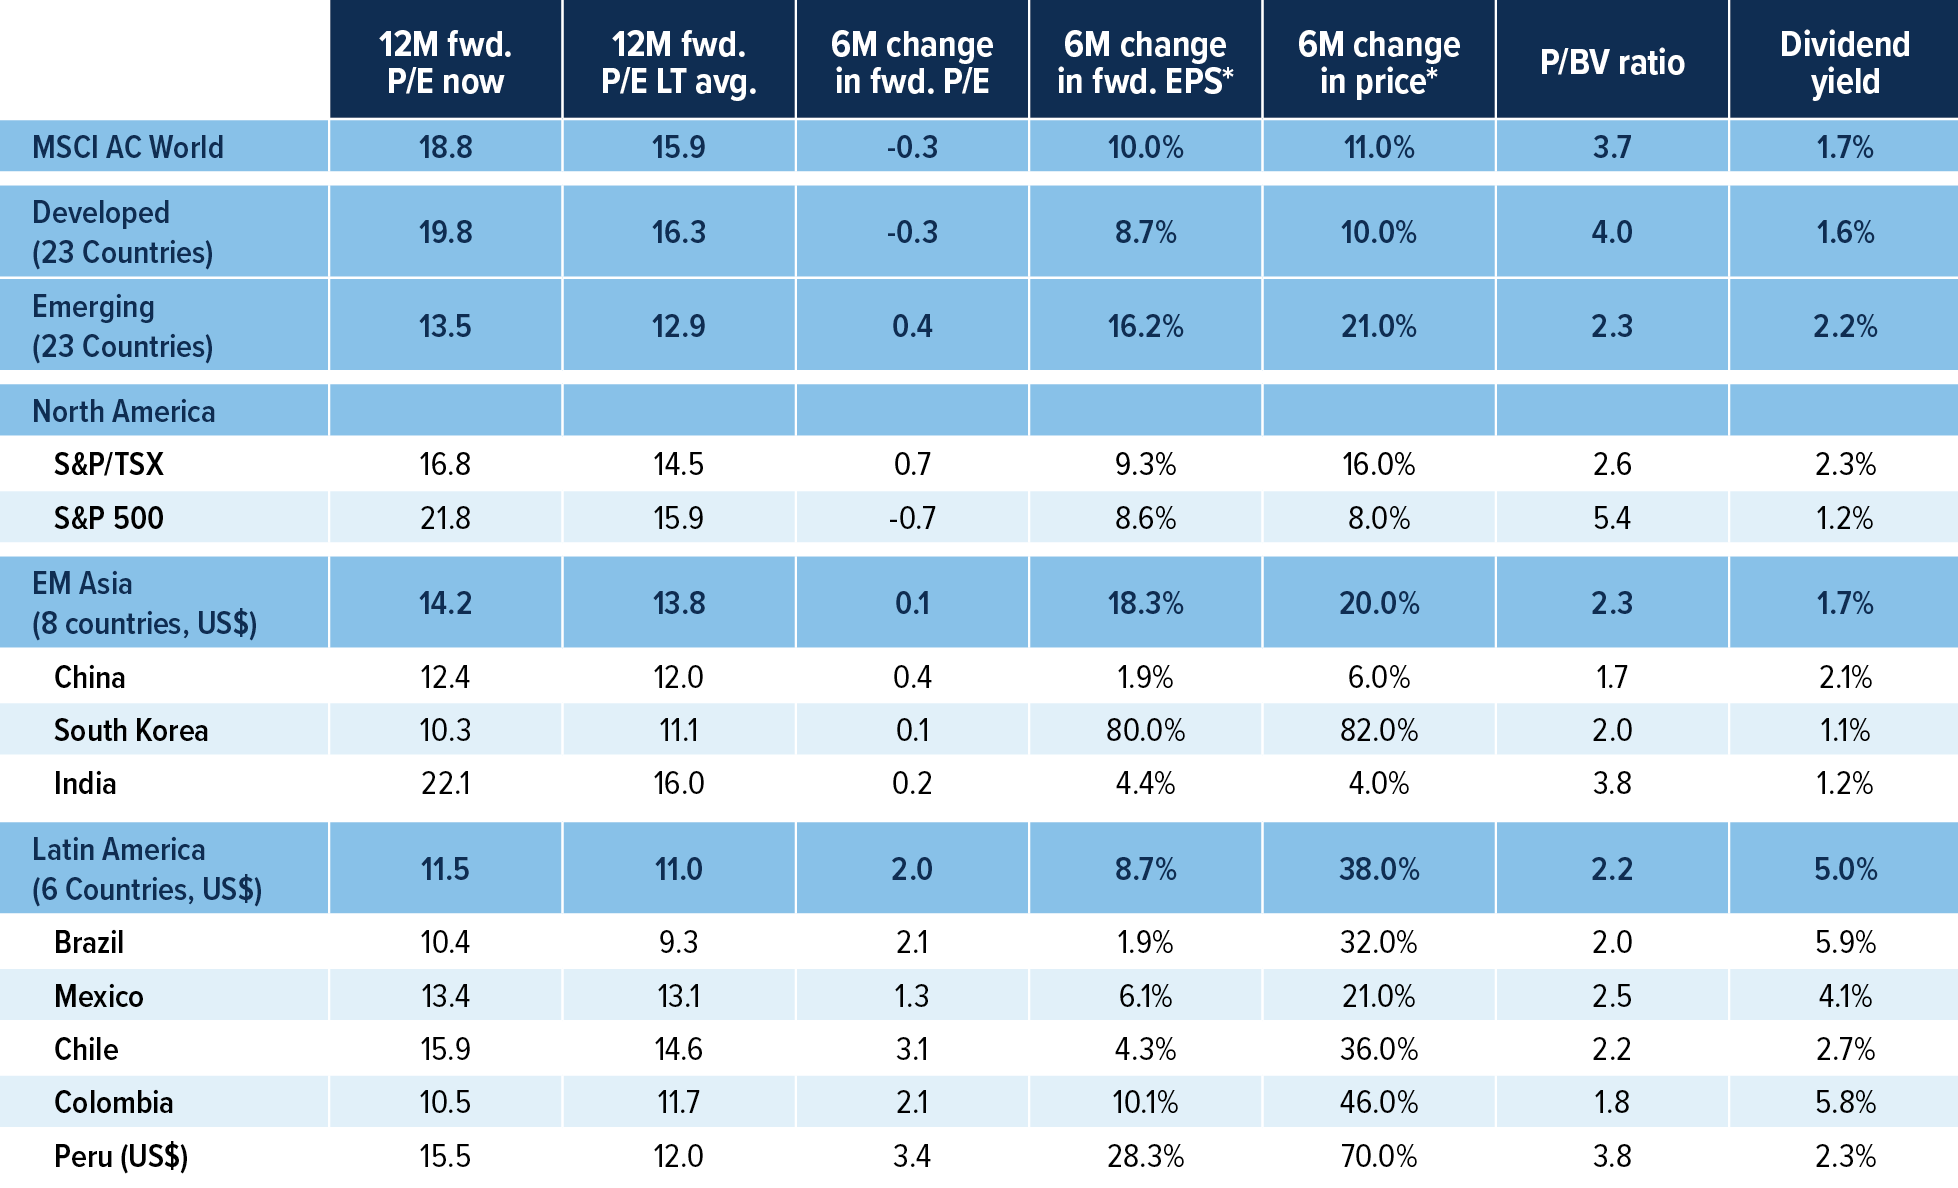
Figure 7
*Local currency unless specified
**Europe, Middle East & Africa
Source: Scotiabank GBM Portfolio Strategy, Bloomberg, LSEG
It is evident from the charts above that EM equities currently trade at a meaningful discount relative to the broader global equity universe. That said, history suggests that valuation alone is a poor timing tool. An asset trading “cheap” does not, in and of itself, provide a sufficient catalyst for prospective appreciation.
Why EM’s inflection point may be here
So why might this be the inflection point where EM equity returns begin to gain traction? We highlight four key factors that support the case for stronger relative performance going forward:
Peak US dollar: EM equities have historically performed well during periods of US dollar weakness. With US growth exceptionalism narrowing and rate differentials compressing, the dollar appears closer to a cyclical peak, easing financial conditions across EM.
Monetary policy flexibility: Many EM central banks tightened earlier and more aggressively than developed markets. With inflation moderating, several now have room to ease policy, supporting domestic demand and earnings growth.
Earnings inflection: After a prolonged earnings recession, forward revisions in several large EM markets are stabilizing or turning positive, creating scope for operating leverage as global trade and manufacturing recover.
Improving structural backdrop: Supply-chain diversification, rising commodity demand tied to energy transition and accelerating digital adoption across EM economies provide durable tailwinds beyond cyclical recovery.
Further, the following charts challenge two common assumptions about global markets and risk.
First, while emerging markets are often perceived as inherently more fragile, a comparative fiscal vulnerability scorecard shows that the United States currently ranks as more fiscally vulnerable than many emerging market countries. See Figure 8.
Fiscal Vulnerability Scorecard
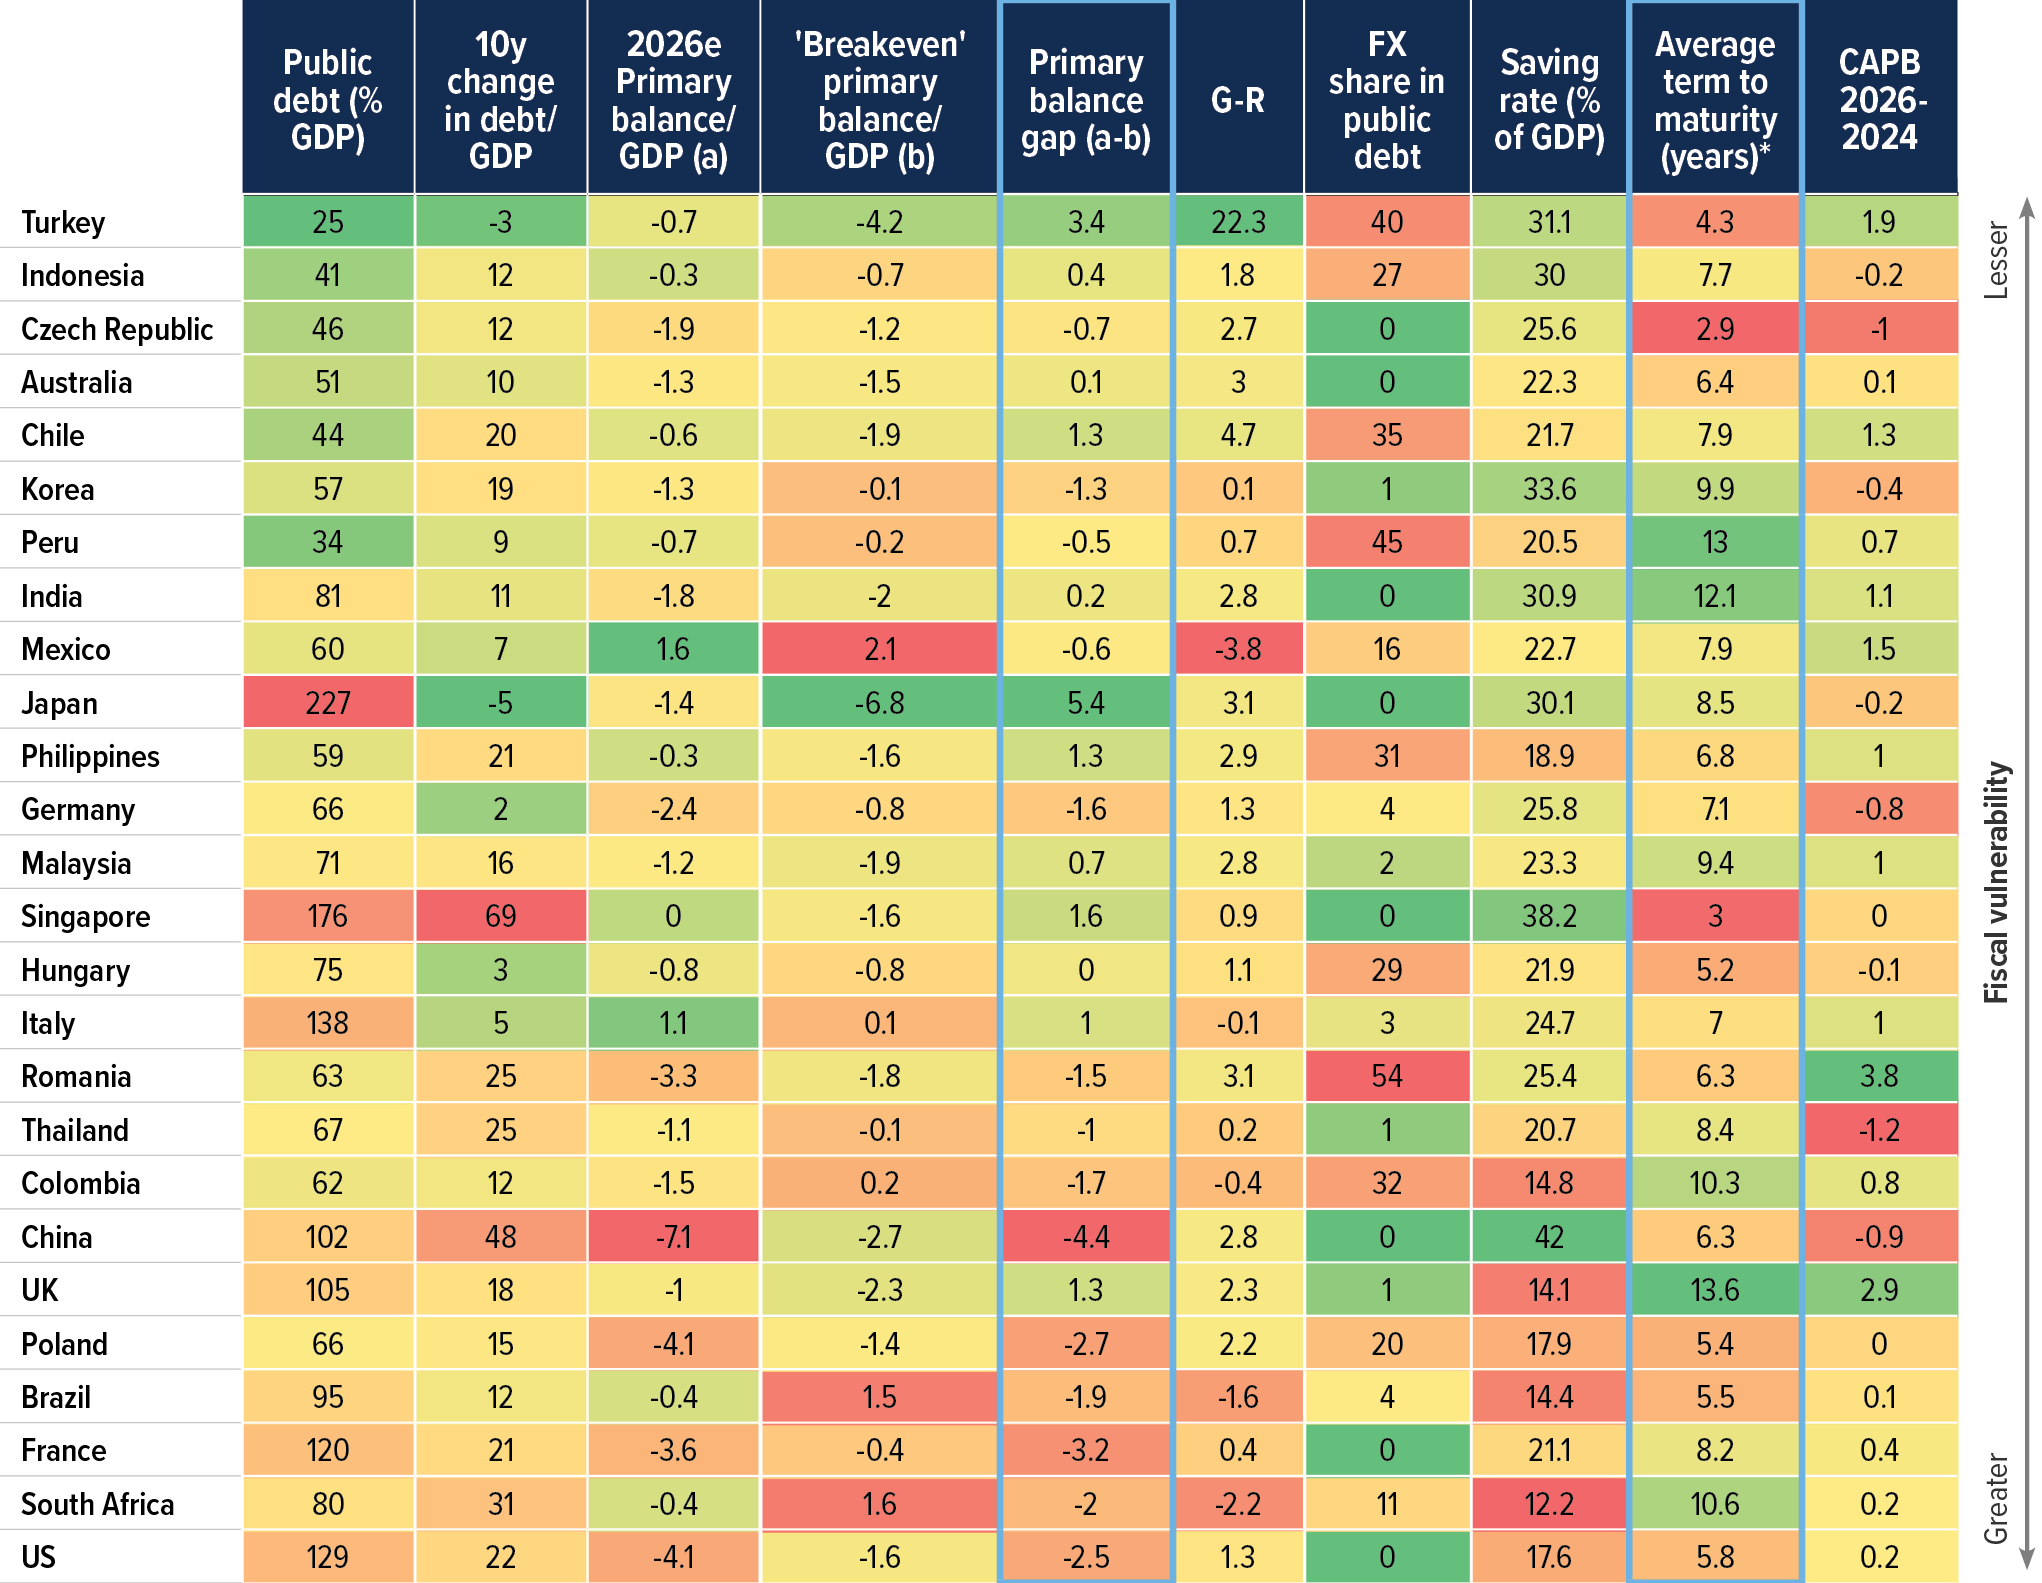
Figure 8
Source: UBS estimates, Bloomberg, IMF, Haver. Ranks are calculated based on weighted average of 5 subcomponents: (1) Public debt to GDP (40%), (2) Primary balance gap (20%), (3) gross national savings to GDP (20%), (4) FX debt share in government debt (10%) and (5) change in debt/GDP over past 10y (10%). Also, here G is calculated by taking average of IMF 2025 and 2026 nominal GDP growth; and R is calculated as 2026 effective interest rate on public debt.
Second, when examining equity market dynamics, emerging market companies typically exhibit higher operational leverage than their developed market peers, implying greater earnings sensitivity to changes in growth and demand. See Figure 9.
EM equities typically have higher operational leverage than DM
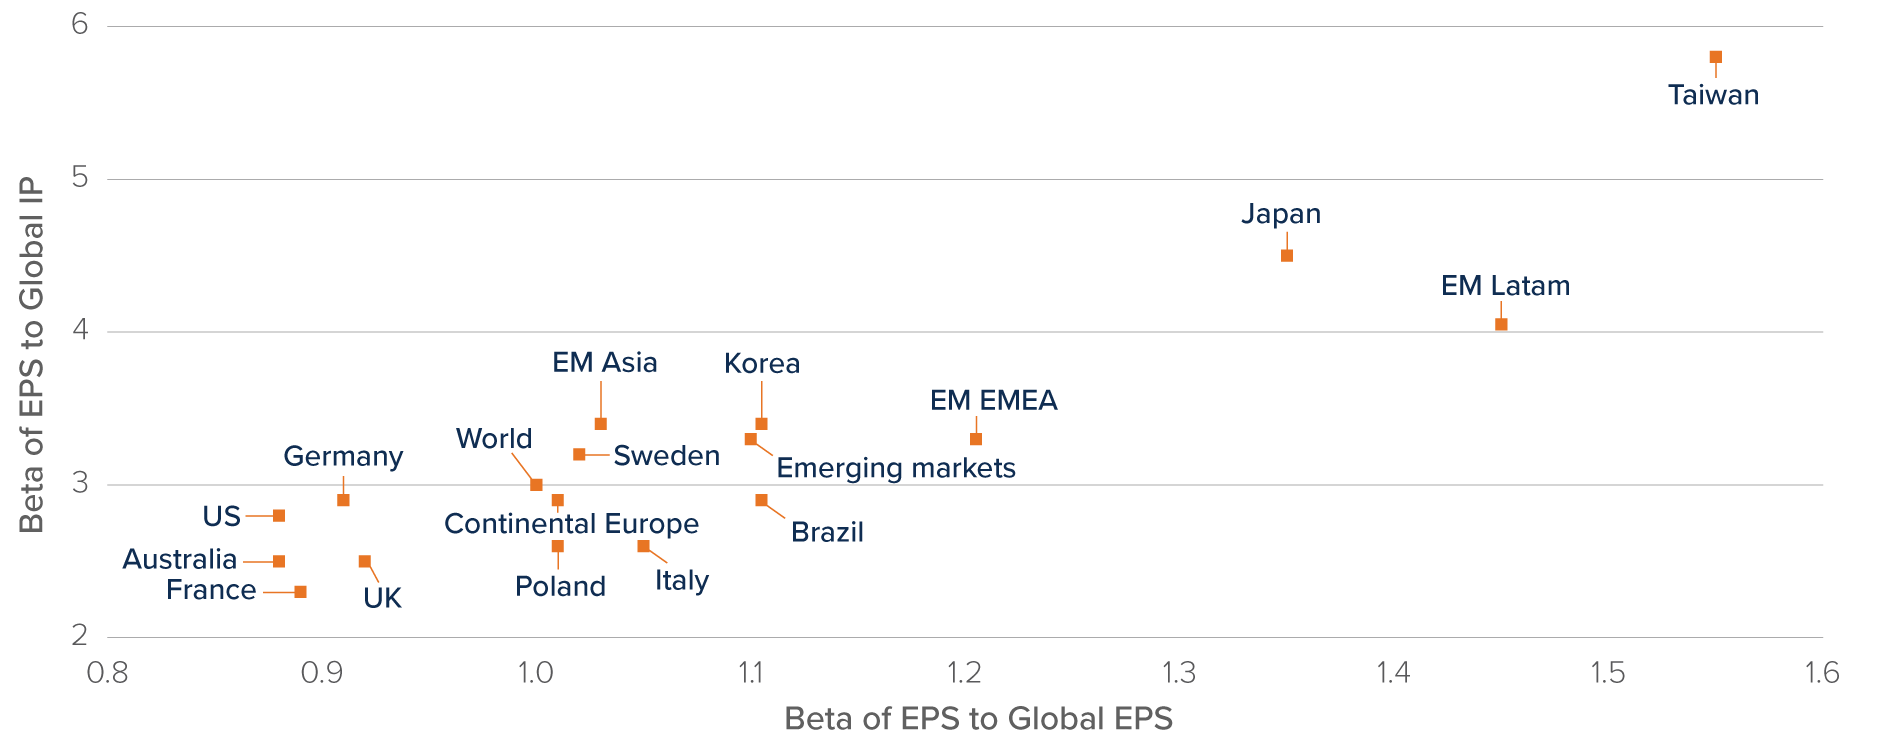
Figure 9
Source: IBES, MSCI, Datastream, Haver, UBS
Taken together, these insights suggest that the developed-versus-emerging market risk narrative may be overly simplistic. A nuanced assessment of macro-resilience and earnings dynamics is essential.
Conclusion:
After more than a decade of relative underperformance, emerging markets may be approaching a pivotal turning point. Valuations remain meaningfully discounted relative to developed markets, earnings momentum is stabilizing and several macro forces that historically supported EM outperformance (including a peaking US dollar and greater monetary policy easing) appear to be aligning. While valuation alone is not a catalyst, it provides a favourable starting point when combined with improving fundamentals and shifting global dynamics.
Importantly, emerging markets should not be viewed as a single, uniform asset class. Dispersion across countries, sectors, governance regimes and demographic trends is significant. China’s structural challenges differ markedly from India’s demographic tailwinds; commodity exporters face a different opportunity set than manufacturing beneficiaries of supply-chain diversification. As such, selective exposure, and active country and sector positioning remain critical.
For Canadian investors, the case is twofold. First, EM equities offer exposure to growth drivers that are distinct from those dominating North American markets, enhancing portfolio diversification. Second, with developed market returns over the past decade heavily concentrated in a narrow cohort of US growth stocks, broadening equity exposure may prove prudent as leadership market evolves.
History suggests that when EM outperformance regimes begin, they often persist for several years. While risks remain, including geopolitical tensions, policy uncertainty and global growth variability, the current backdrop may represent a rare window to build or rebalance allocations at attractive valuations. For long-term investors willing to look beyond recent history, emerging markets could once again emerge as a meaningful contributor to diversified portfolio returns.
Multi-Asset Strategies Team’s investment views
Tactical summary
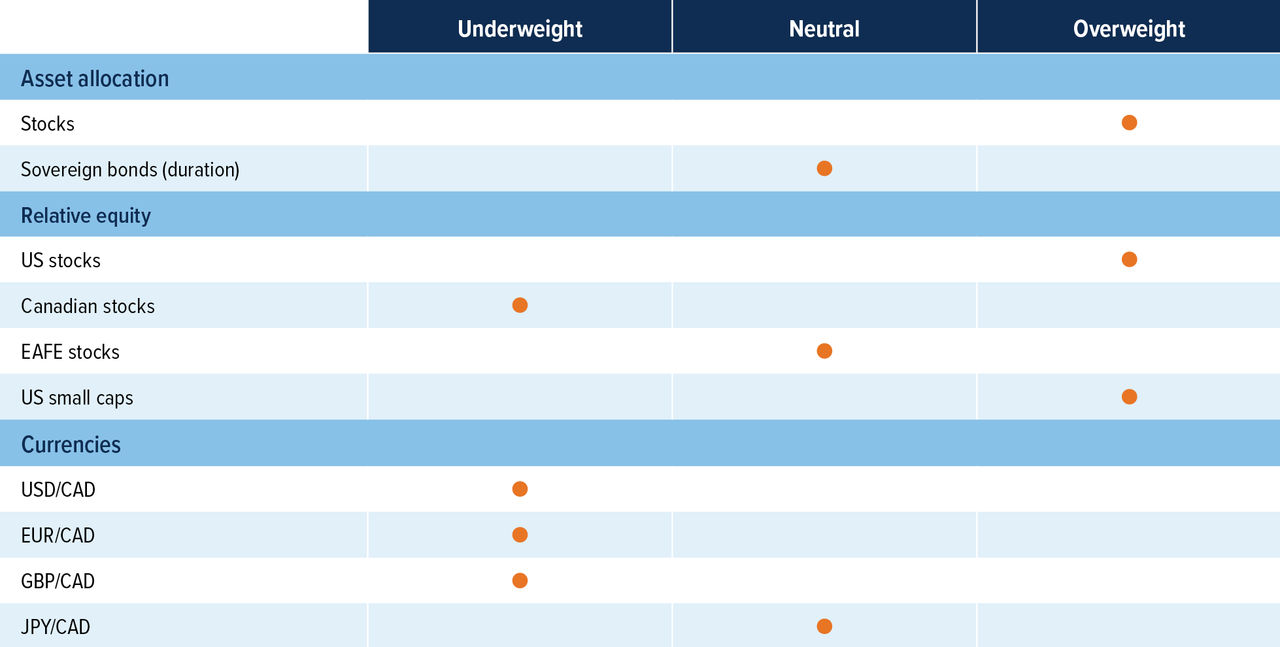
Source: Mackenzie Investments.
Note: The opinions expressed in this piece reflect short-term tactical views, which inform the positioning of some of the funds managed by the Multi-Asset Strategies Team.
Positioning highlights
Equity allure remains: Earnings season in the US has been mixed relative to historical norms, with market sentiment remaining subdued. Even companies that have delivered upside surprises have not seen corresponding price gains. Despite this, analysts’ price targets have risen, and we continue to expect a strong year for equities from both a macro and sentiment perspective.
Going back to neutral duration: We have been more tactical on US duration as 10‑year yields hover around fair value. We were long bonds as yields fell following a weak CPI print. However, after a blockbuster US jobs report showing 130,000 jobs added in January 2026—the strongest monthly gain in more than a year and well above consensus expectations—we moved back to neutral, as the US economy appears to remain resilient.
Buy US vs. Canada equities: The TSX has outperformed the S&P 500 in 2025 due to financials and a large weight to materials while all other sectors underperformed. As a result, the TSX doesn’t look as attractive from a valuation perspective. Meanwhile, in the US, the breadth of stock outperformance has increased recently. Also, US economic data is coming in stronger than Canada’s which should be supportive for US equities over Canada.
Currencies: USD remains overvalued, and our long-term view is for it to depreciate versus most developed countries. We continue to like CAD and JPY as the best play for this view. With oil up strongly in January, it should be supportive for Canada’s economy compared to other currencies.