
Highlights
- Investors could benefit significantly if they were able to get an early read on the likely path of the S&P 500 over the months ahead.
- When cyclical stocks take and sustain leadership over defensives, it typically coincides with improving growth expectations and stronger broad market conditions.
- Our Multi-Asset Strategies Team has developed a methodology to classify companies as cyclical and defensive individually, rather than relying on sectors.
Introduction
Navigating equity markets effectively requires more than just understanding current trends; it demands a keen insight into the subtle signals that precede market movements. This month's commentary explores a straightforward yet powerful approach to anticipating the S&P 500's likely path by analyzing the relative performance of cyclical and defensive stocks — and not by sector.
Historically, the market's decision on whether to buy or sell cyclical or defensive stocks gives investors a clear idea of what the market is doing. This information helps investors plan their portfolios for the economic cycle.
What cyclical performance can tell us:
This paper examines one idea for navigating equity markets using information that is already visible in equity prices. Cyclical companies are those with revenues and earnings that tend to rise when the economy accelerates and soften when growth slows. They often operate with high operating leverage and sell products or services tied to discretionary spending or business investment, which makes their profitability more sensitive to changes in the business cycle. Defensive companies, by contrast, sell necessities and provide services that households and businesses purchase in similar amounts across environments, resulting in steadier cash flows and less variable earnings.
Our central finding is that the market's day-to-day verdict on these two groups appears to contain an early read on the S&P 500's likely path over the months ahead. When cyclical stocks take and sustain leadership over defensives, it typically coincides with improving growth expectations and stronger broad market conditions. When defensives lead, it often signals rising caution and weaker markets. Because sector labels mix business models with very different macro sensitivities, we classify companies directly rather than relying on sectors, build clean cyclical and defensive cohorts and show how moves in their performance spread have lined up with past turning points. The objective is not to forecast the economy in isolation, but to translate observable leadership in equity markets into timely portfolio signals.
We provide an actionable tool that advisors and investors can use to position their portfolios.
Identifying cyclical companies:
Cyclical companies are businesses with revenue and earnings that fluctuate in line with the broader economic cycle. Their financial performance typically improves during periods of economic expansion and weakens during economic slowdowns or recessions. These companies operate within industries where consumer or business spending is discretionary; purchases can be deferred or reduced when confidence in the economy declines.
Industries commonly associated with cyclical behaviour include hospitality, restaurants, entertainment, travel and luxury goods. Additionally, sectors involving larger, credit-financed purchases, such as automobiles and residential housing, tend to be highly cyclical. Companies operating in these areas are particularly sensitive to shifts in employment, interest rates and consumer sentiment. For example, homebuilders and automobile manufacturers often see earnings expand rapidly during booms but face pronounced contractions when economic conditions deteriorate.
Although cyclical companies often exhibit high earnings volatility, volatility itself is not a defining characteristic. The distinguishing factor is the direct correlation between a company's financial performance and the broader economic environment. A company may experience considerable earnings fluctuations, but if those fluctuations are independent of macroeconomic trends, it is not classified as cyclical. Speculative pharmaceutical firms, for example, may have no commercial products and instead generate sporadic revenue from milestone payments tied to research partnerships or clinical trials. While unpredictable, these cash flows are unrelated to the broader economy. Similarly, Strategy Inc., a software company with large Bitcoin holdings, reports volatile income as accounting rules require marking its cryptocurrency to market each quarter. The variability in both cases stems from idiosyncratic factors rather than economic expansion or contraction, meaning such firms are not classified as cyclical.
Examples of cyclical and defensive companies:
To understand the characteristics of cyclical companies, consider Burlington Stores, a clothing retailer selling discretionary products. Figure 1 compares Burlington’s earnings with aggregate market earnings. Between 2016 and 2019, both rose steadily, with Burlington outpacing the market. During the COVID-19 downturn, market earnings fell by 50% while Burlington’s turned negative. In the rebound, Burlington recovered faster, only to see earnings fall again by 50% during the post-COVID inflationary period, even as market earnings slipped only modestly.
Burlington Stores, earnings vs. market
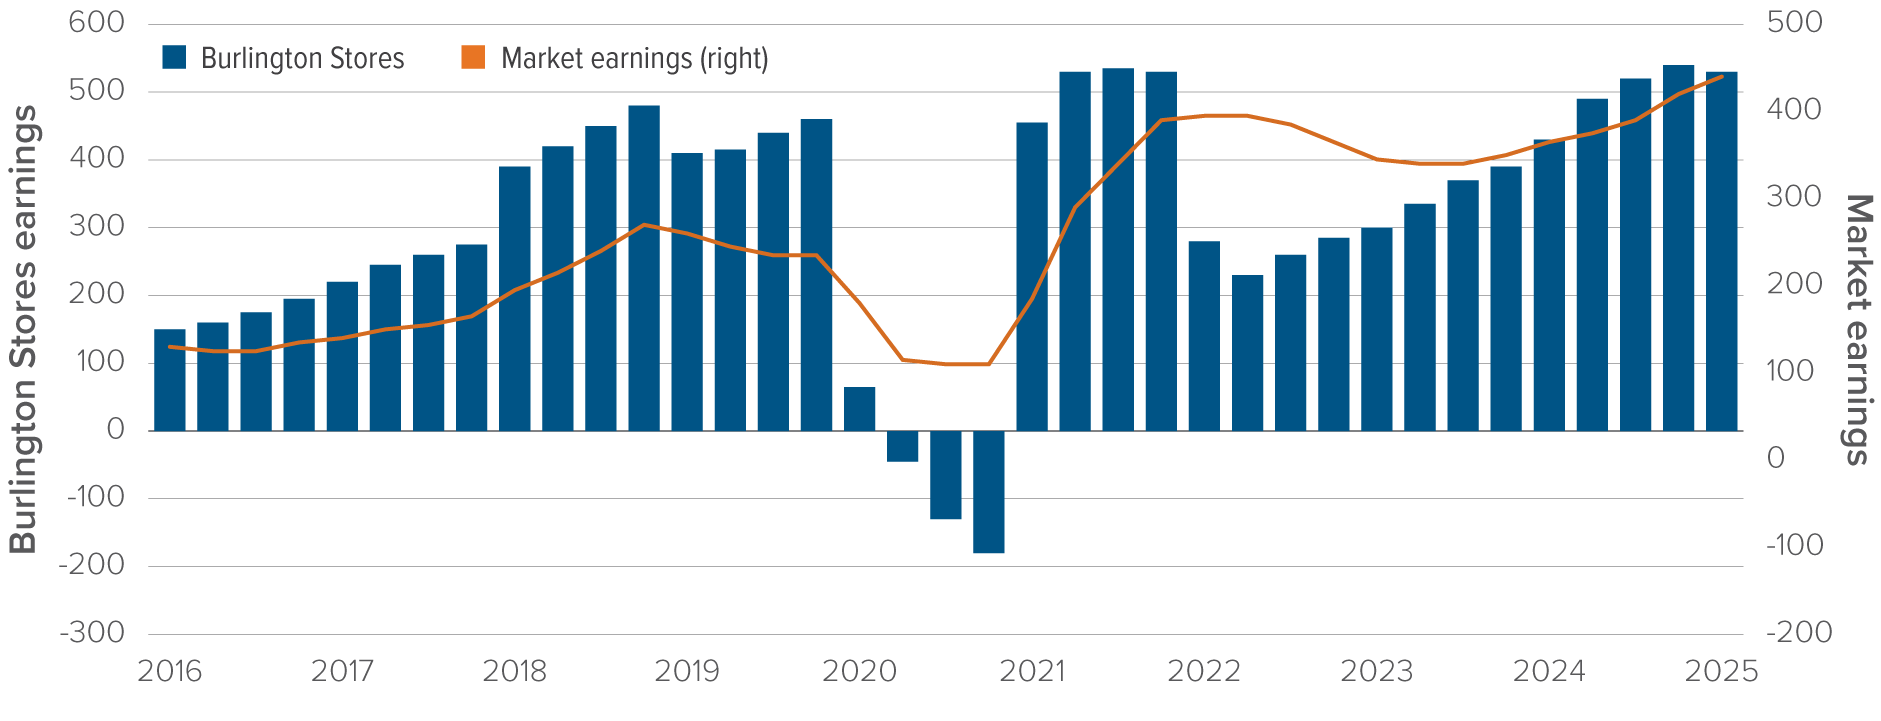
Figure 1
Source: Mackenzie Investments.
A comparison of Burlington’s income statements between 2019 and 2021 highlights the drivers of this sensitivity. Sales declined in 2021, and gross margins narrowed slightly, but the main issue was rising selling, general and administrative (SG&A) expenses. These fixed costs increased from 30% to 40% of sales, overwhelming profitability and pushing net income negative. This reliance on fixed costs illustrates high operating leverage, a defining feature of cyclical firms. Small revenue swings can lead to disproportionately large changes in earnings, particularly around economic turning points. If sales fail to rebound, bankruptcy becomes a real risk.
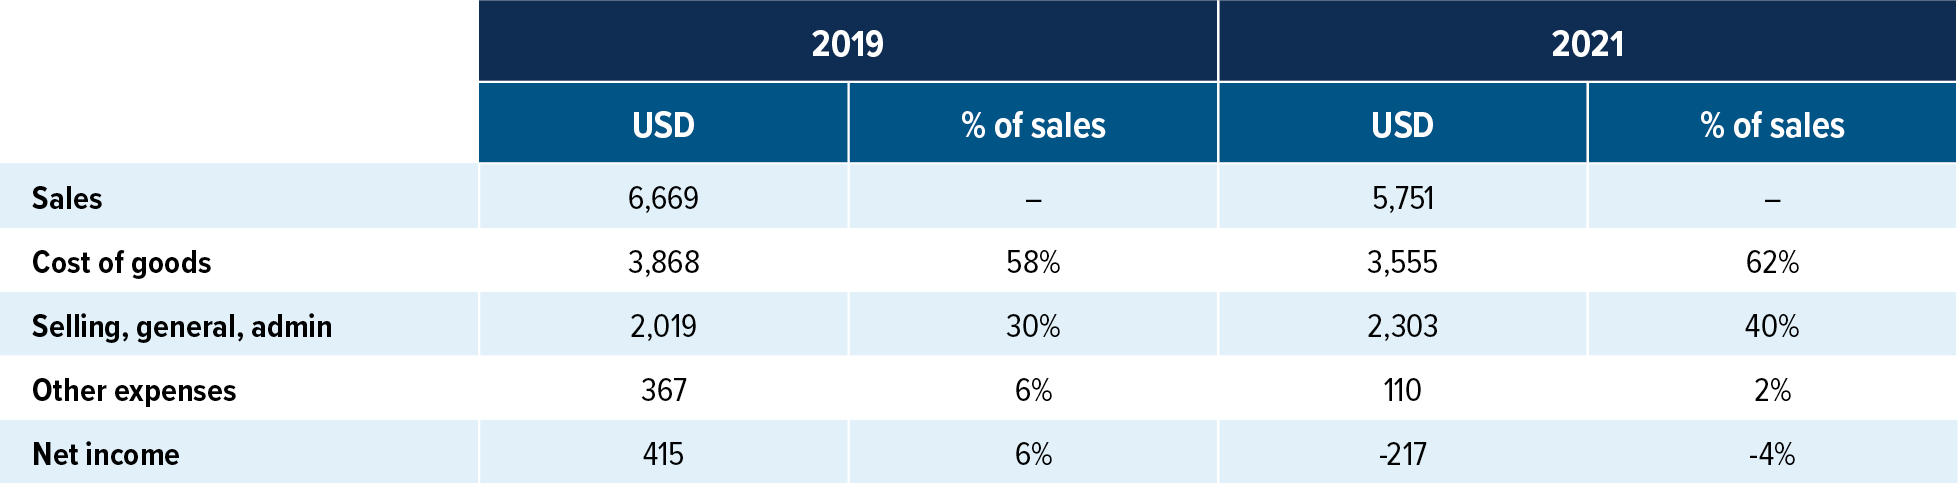
Figure 2
Source: Mackenzie Investments.
Salesforce is a cloud software company with earnings that have been volatile, ranging from near zero to over $6 billion, but the fluctuations do not consistently track the broader economy. For example, in late 2021, market earnings surged while Salesforce’s declined. Despite its variability, Salesforce is not cyclical because its performance is not systematically tied to macroeconomic trends.
Salesforce, earnings vs market
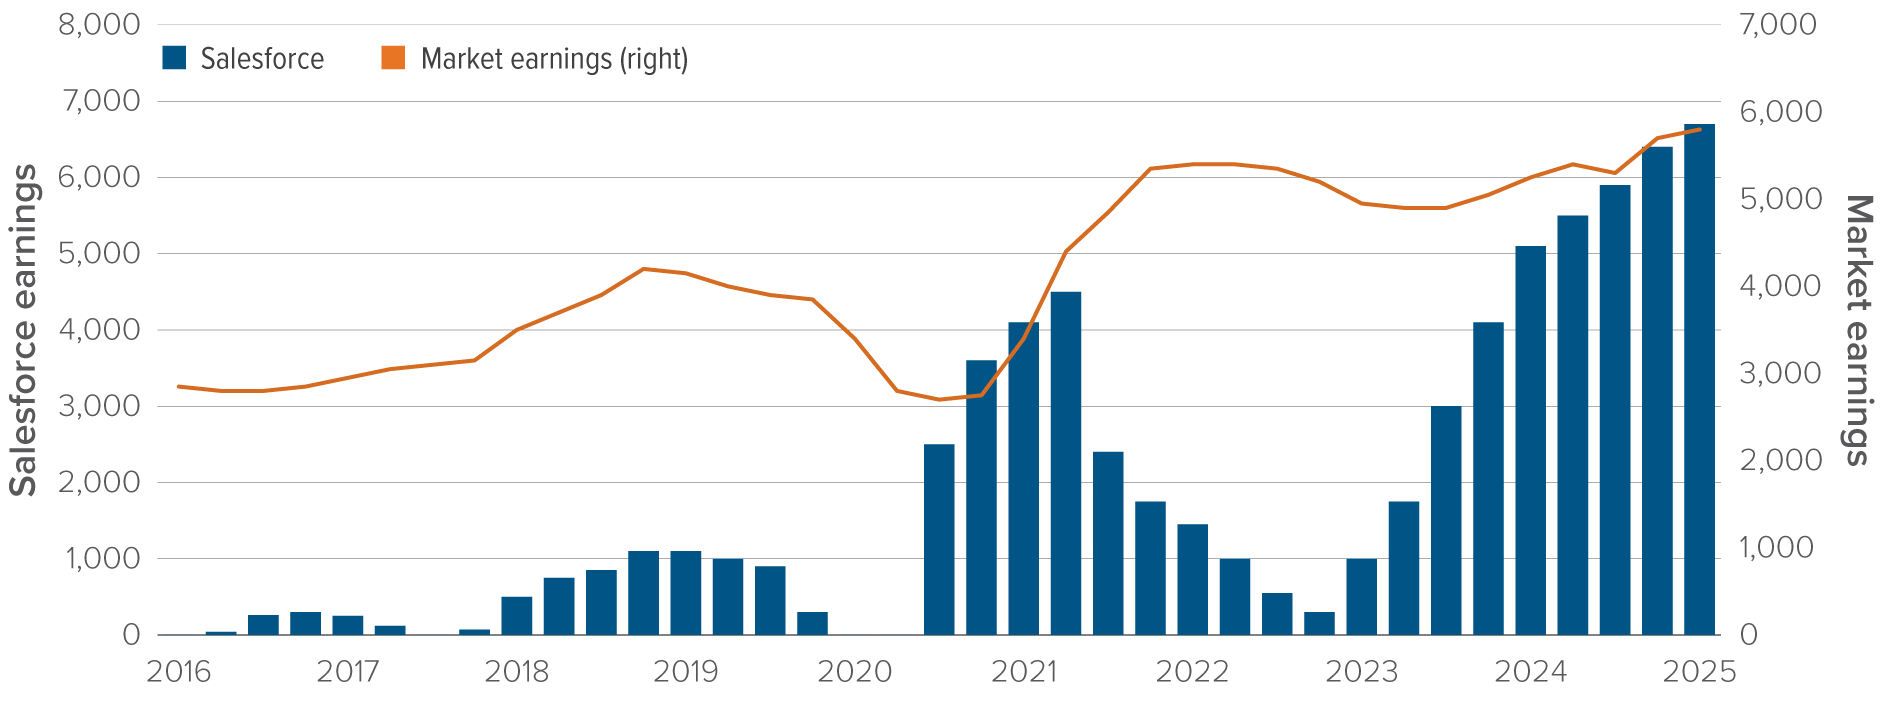
Source: Mackenzie Investments.
Kimberly-Clark, by comparison, produces personal care products such as Huggies and Kleenex, which consumers buy regardless of economic conditions. The company’s earnings have held within a narrow range of $2.0 to $2.5 billion for years, diverging from the market in some periods and aligning in others. Kimberly-Clark is a classic defensive company, delivering consistent results through the cycle.
Kimberly-Clark, earnings vs market
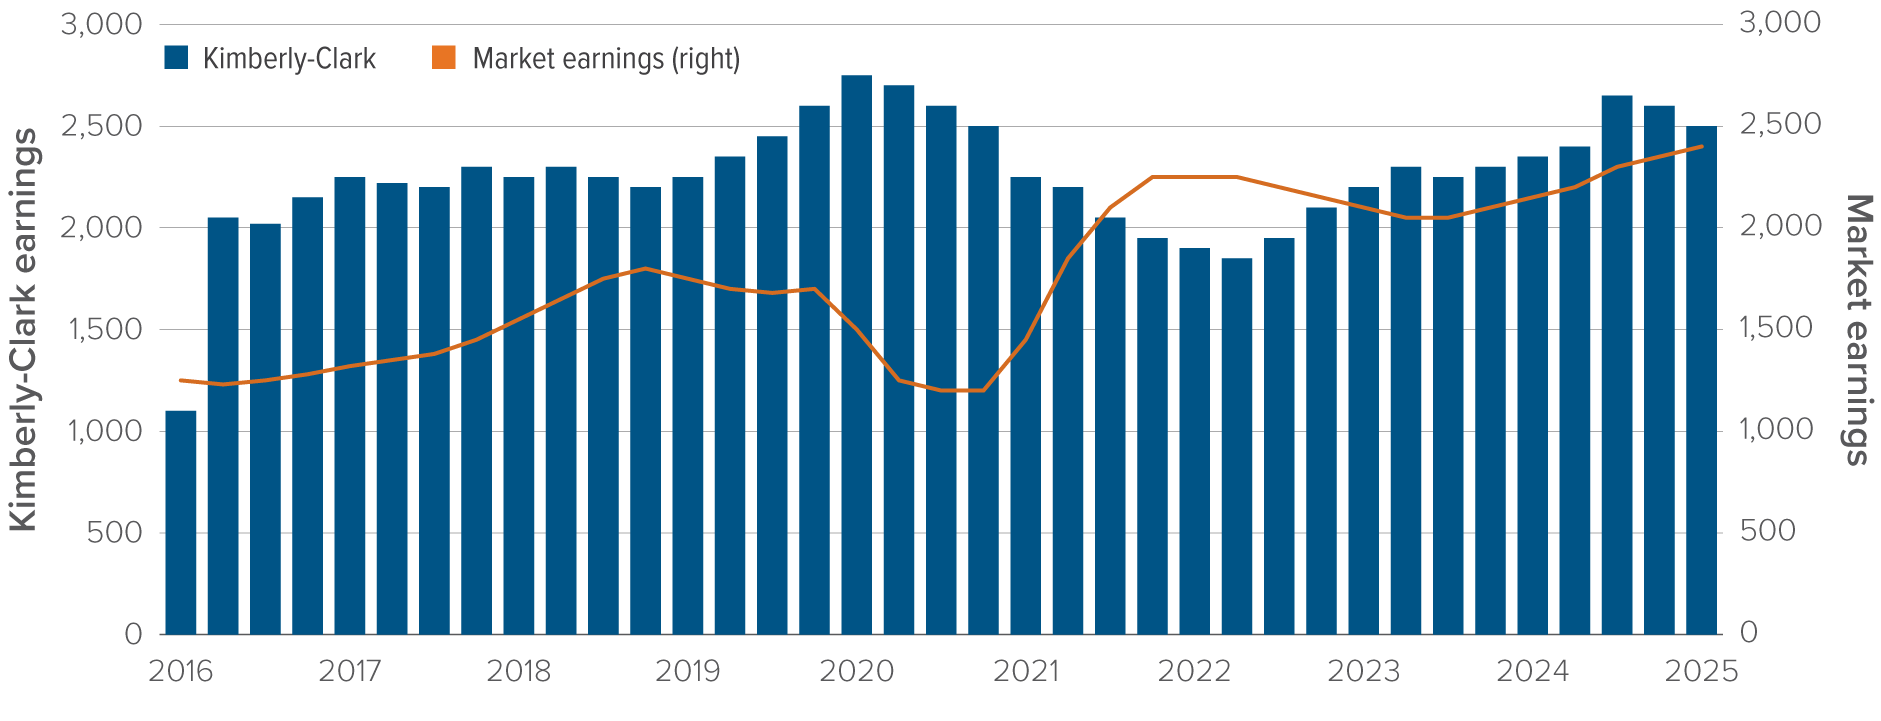
Figure 4
Source: Mackenzie Investments.
Using sectors as a proxy for cyclical companies
Investors have traditionally used sector classifications as proxies for identifying cyclical and defensive companies. While this offers broad guidance, it is far less precise than the methodology we propose. Few sectors are composed primarily of cyclical firms, and most contain a mix of cyclical and defensive companies. Figure 5 shows the breakdown within the MSCI United States IMI Index, highlighting the limits of sector-based approaches.
Share of companies by sector that are cyclical or defensive, as of July 2025
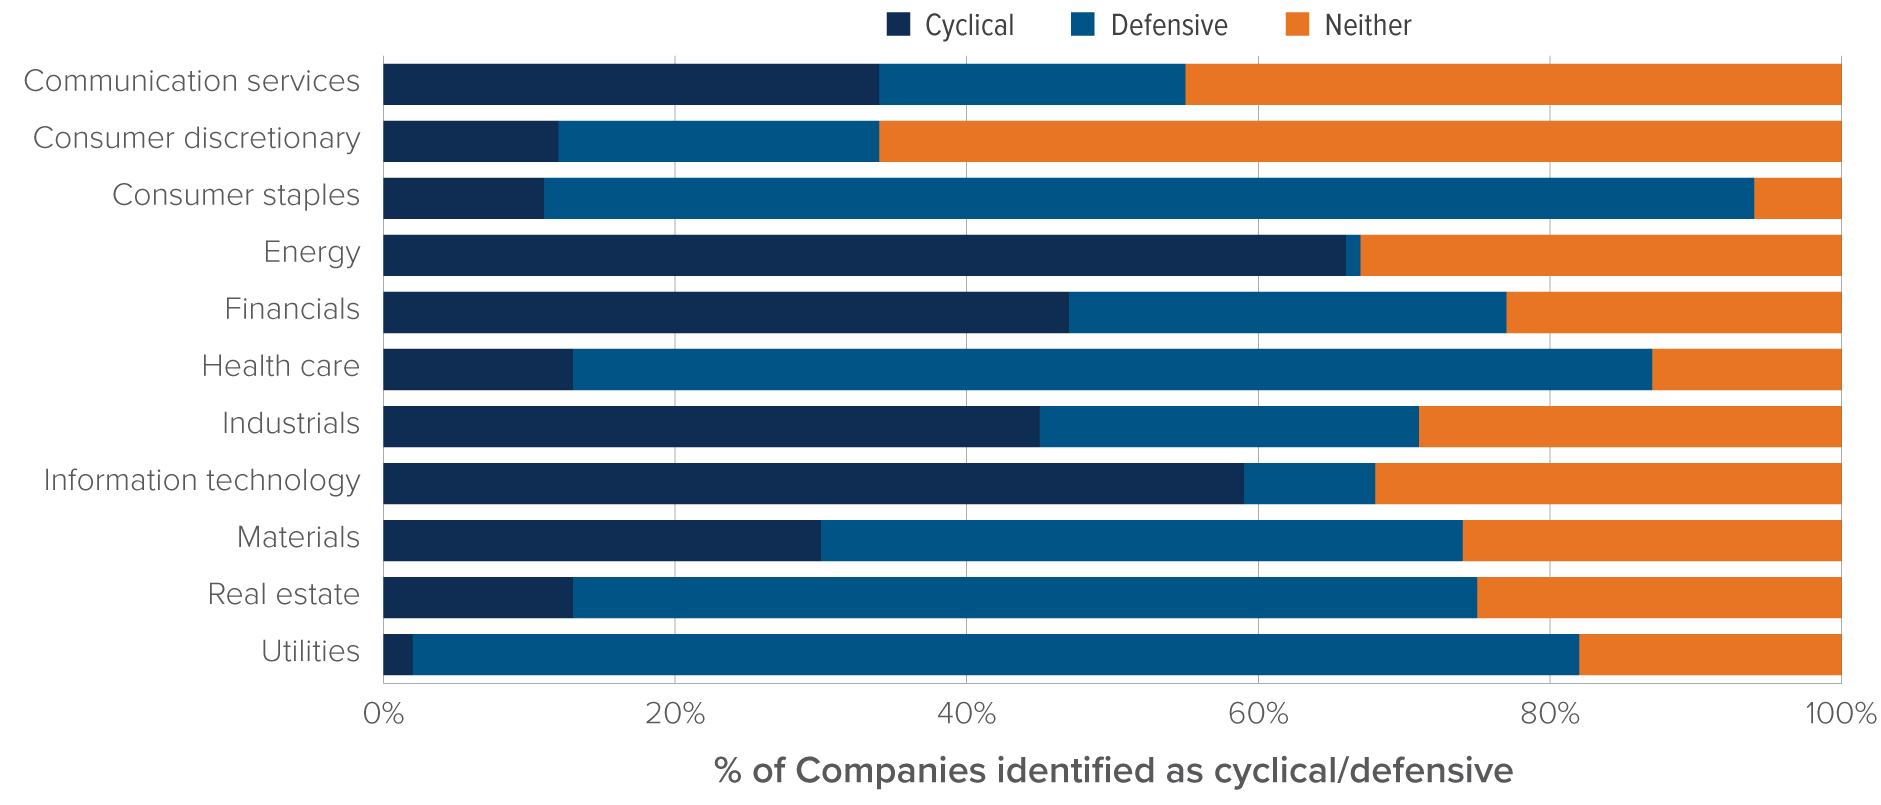
Figure 5
Source: MSCI USA IMI Index; classification of constituents into cyclical and defensive categories, July 2025.
Certain sectors clearly lean defensive, including consumer staples, health care and utilities, where earnings remain stable even in downturns. Others, however, are highly mixed. A notable reclassification occurred in 2018 when MSCI transformed its telecommunications sector into communication services, combining social media and search companies with traditional telecom providers. The result is a sector that blends both cyclical and defensive characteristics.
The consumer discretionary sector also illustrates this diversity. Amazon, with businesses spanning retail, cloud computing, logistics and advertising, has earnings far less tied to the cycle, while Tesla behaves like a growth startup, with rising earnings regardless of economic conditions. Industrials are similarly diverse: trucking and airlines are deeply cyclical, while aerospace is less sensitive due to long production cycles. The sector also exposes quirks in GICS classification. Uber, for example, is grouped with rental car companies such as Avis and Budget. Yet rental firms own large fleets, creating high fixed costs and strong cyclicality, whereas Uber’s asset-light model is significantly less cyclical despite consumer exposure.
These examples illustrate why we choose to classify companies directly, rather than monitor the performance of cyclical and defensive sectors.
Cyclical companies at economic turning points:
Now that we have established how to identify cyclical companies, we turn to a use case for market timing.
Markets tend to absorb growth shocks gradually, and this adjustment often manifests as a sustained rally following an initial surprise. The lag in collective adjustment creates opportunities for investors who are able to reposition more quickly than other market participants.
At the same time, some investors shift their portfolios in anticipation of turning points in the cycle, often before such changes are fully reflected in headline market movements or economic data. These adjustments are not always visible at the index level and can occur even when the broader market is moving in the opposite direction. Recall that cyclical companies have earnings highly sensitive to economic conditions, which means their valuations can shift dramatically when growth deviates from expectations. Anticipating a growth shock, investors will typically rotate between cyclical and defensive stocks to position themselves for the coming change.
The 2018 drawdown provides a clear example of this dynamic. While the broad market rallied from June through October, cyclical stocks underperformed sharply. Global growth was weakening, particularly in Europe and China. Trade tensions escalated as the United States imposed tariffs on Chinese goods and China responded in kind. Corporate forward guidance for 2019 was being revised lower, and the Federal Reserve was continuing to raise interest rates. The tipping point came on October 3, when Chair Jerome Powell remarked that interest rates were “nowhere near neutral.” From that point, the S&P 500 declined nearly 20% between October and December, underscoring how shifts in growth expectations and policy can ripple through cyclical positioning well before the broader market fully reacts.
Figure 6 clearly demonstrates that cyclical stocks both anticipated and led the market into the 2018 drawdown, highlighting their effectiveness as indicators of shifting macroeconomic sentiment. Cyclical stock performance frequently serves as a leading indicator of broader market movements, providing investors valuable signals regarding future economic conditions.
Comparison of cyclical and defensive stock performance prior to 2018 drawdown
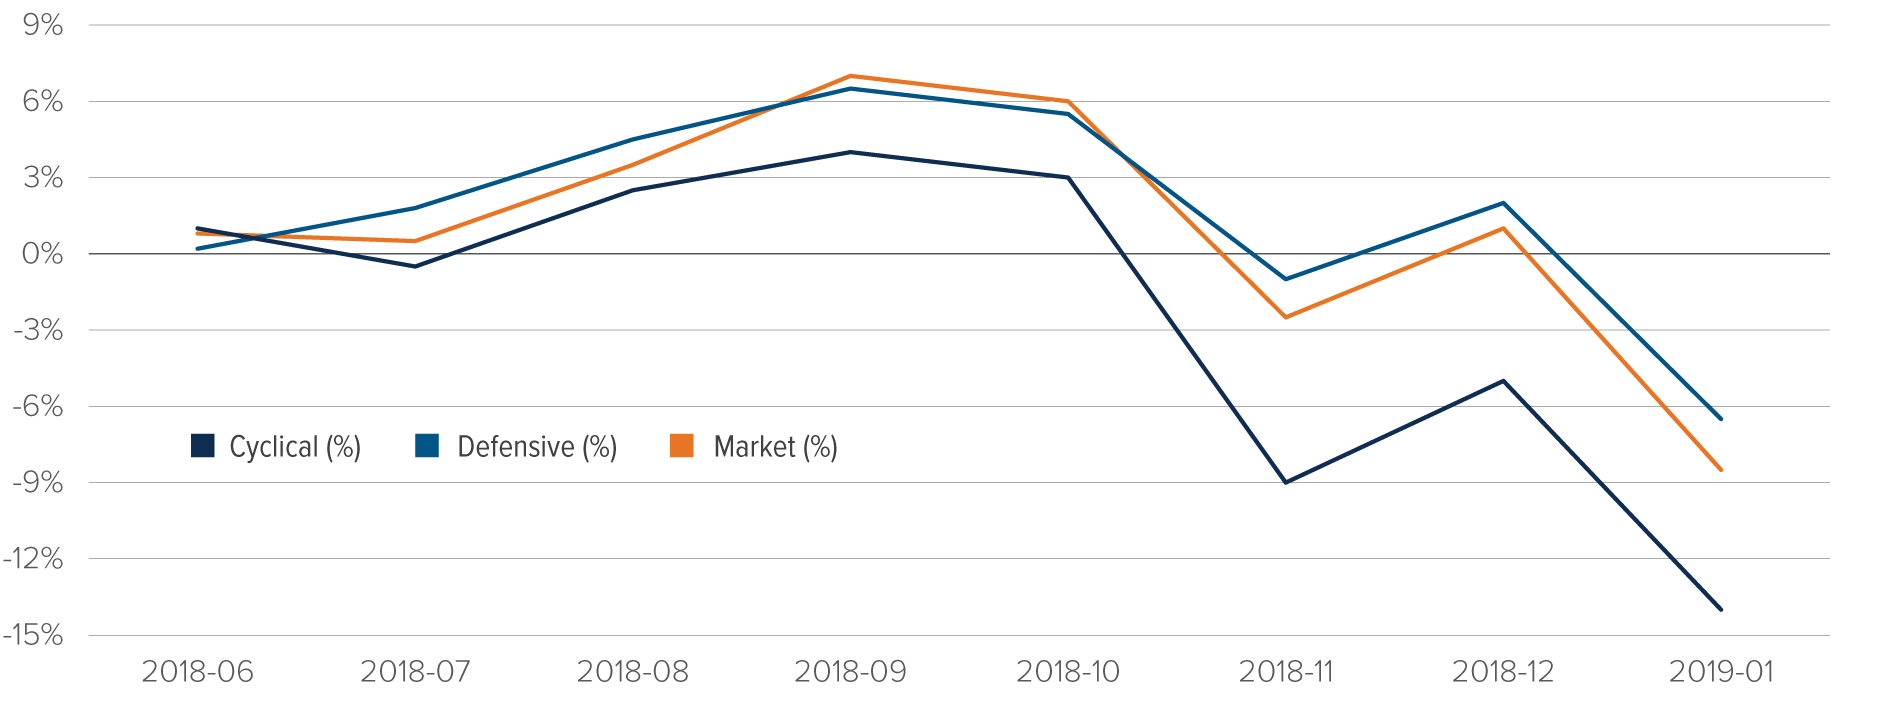
Figure 6
Figure 7 illustrates that investors have historically anticipated periods of market stress by shifting their exposure toward defensive stocks. Although the performance differential has varied in magnitude, defensive stocks have consistently outperformed cyclical stocks in the periods immediately preceding market declines. Notably, cyclical stocks managed to outperform defensive stocks in only one of the nine significant market drawdowns since 2007, underscoring the reliability of defensive positioning as a strategic tool for managing risk ahead of economic downturns.
Defensive vs. cyclical performance prior to significant market declines
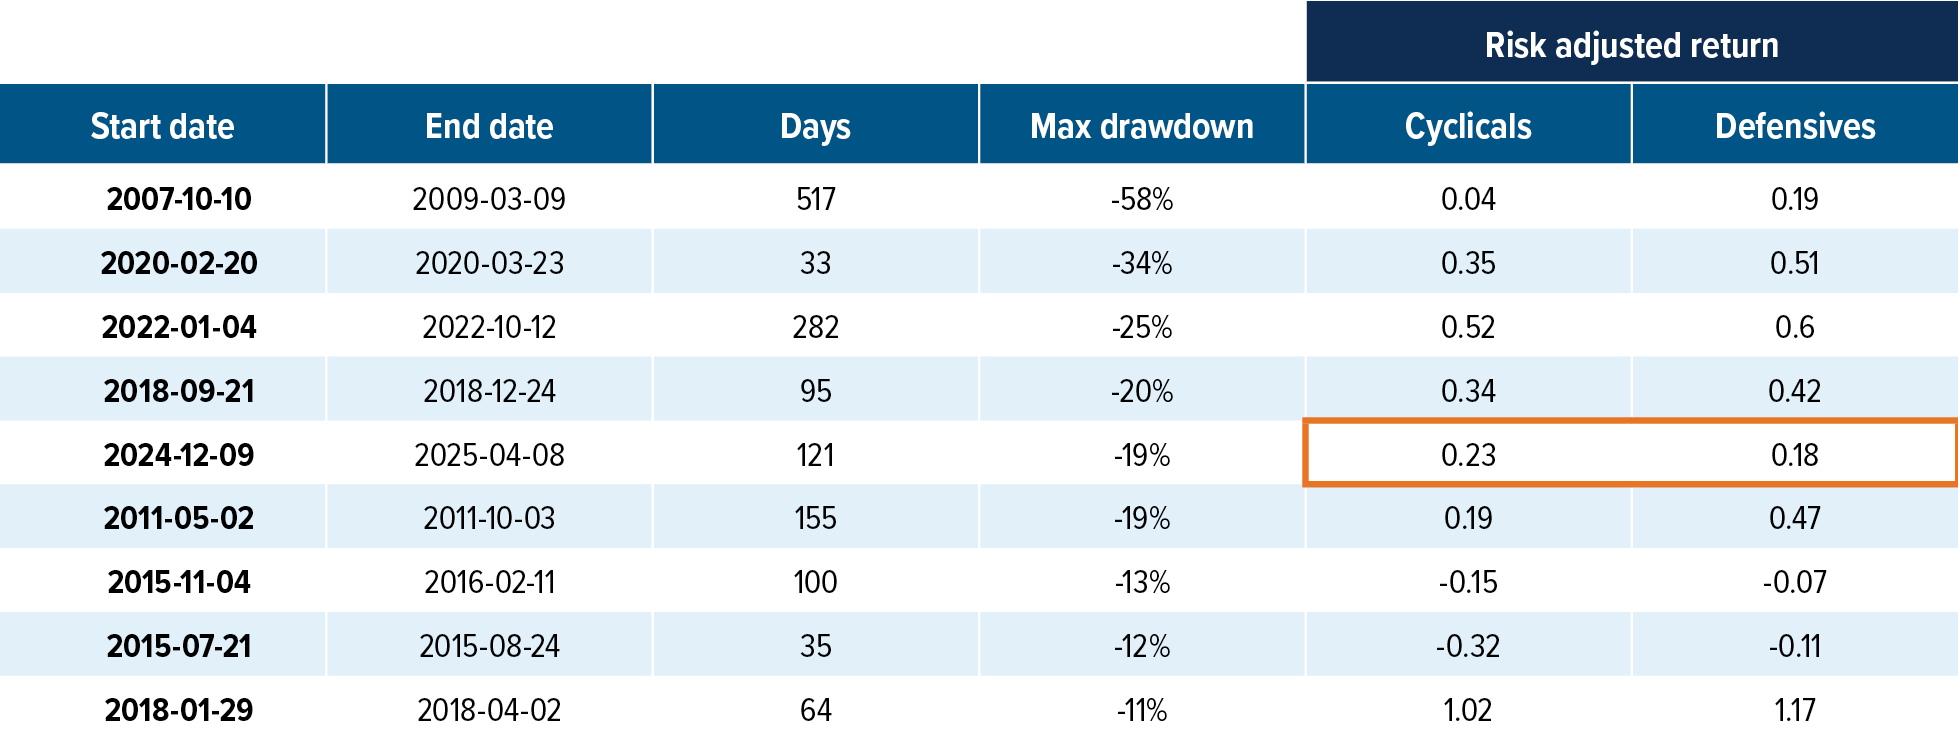
Figure 7
Source: Mackenzie Investments.
We can see that the cyclical-defensive performance differential is an indicator for impending drawdowns.
Cyclical / defensive stock performance as a predictor of S&P 500 return
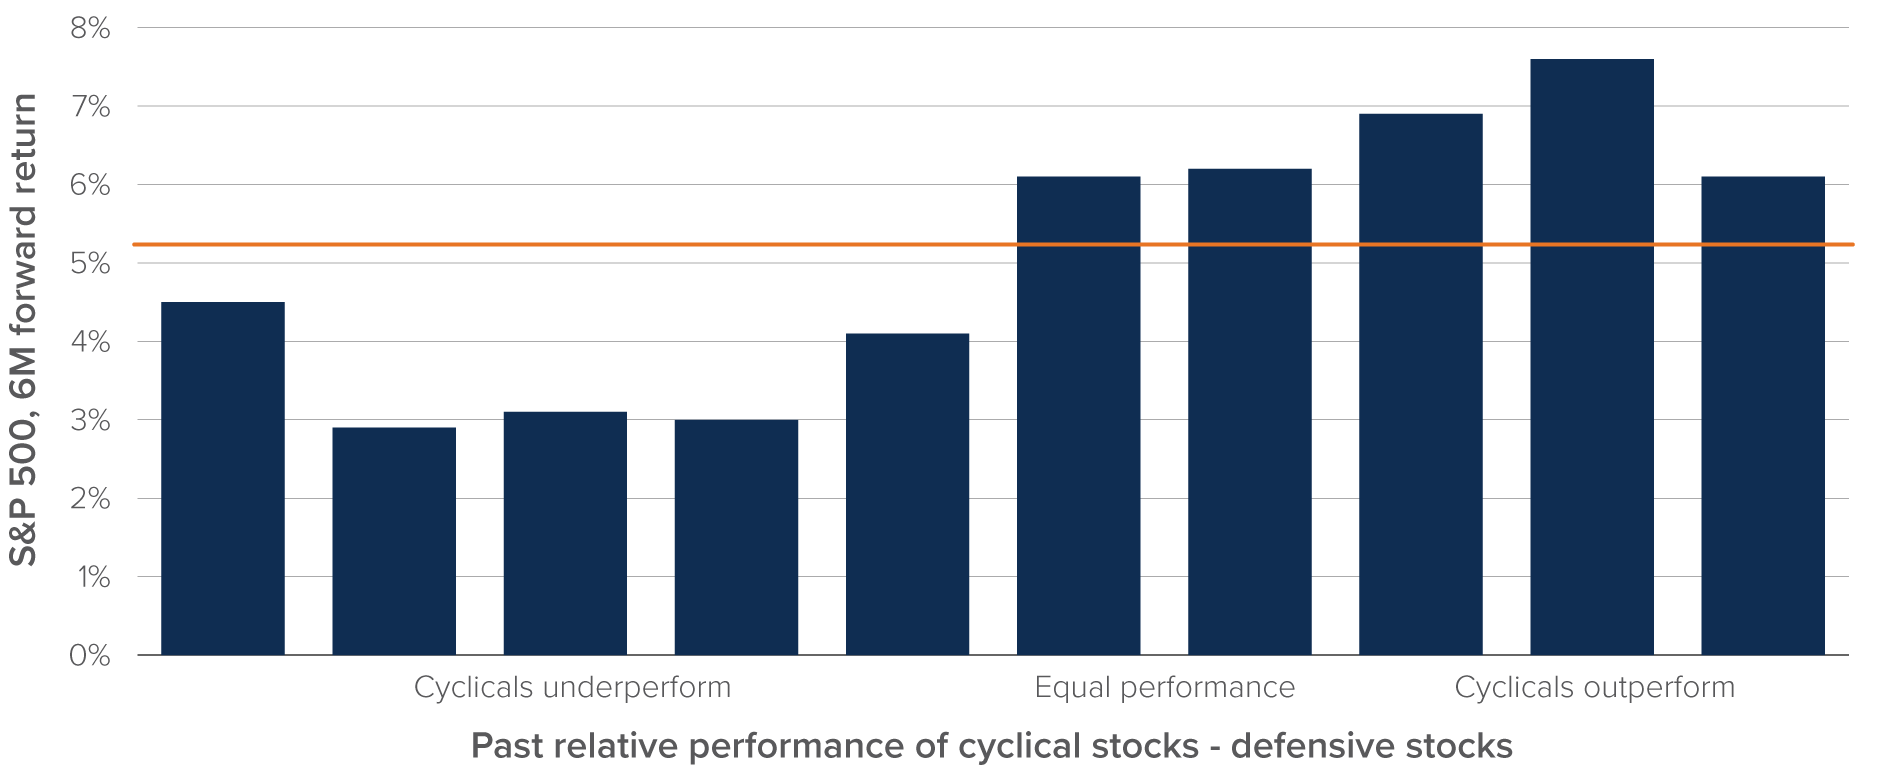
Figure 8
Source: Mackenzie Investments.
In figure 8, we illustrate the relationship between the relative performance of cyclical versus defensive stocks and subsequent S&P 500 returns. The orange line indicates the historical average return of the S&P 500 over cash, providing a baseline for comparison.
Historically, when cyclical stocks have outperformed defensive stocks, the S&P 500 return over the following six months has exceeded its historical average, signaling stronger-than-typical market returns. Conversely, periods in which defensive stocks outperform cyclical stocks have tended to precede weaker-than-average future market performance. This pattern demonstrates the predictive power of cyclical versus defensive stock performance as a general indicator of future market direction.
Actionable Insight
Advisors can monitor the relative performance of cyclical and defensive equities as a practical tool for assessing the US equity market. When cyclical stocks outperform defensives over a three-month period, it often reflects positioning for stronger growth and has historically coincided with above-average market returns. Conversely, leadership from defensive stocks can signal rising caution and the potential for weaker conditions.
This dynamic can be observed through investable proxies, such as the relative performance of the Mackenzie Cyclical Tilt (MCYC) and Mackenzie Defensive Tilt (MDEF) ETFs. These tools can also support implementation, with investors tilting toward cyclical exposures in stronger environments and toward defensives when conditions deteriorate
However, the relationship is not entirely linear, as some mean reversion occurs at extreme performance differentials. When cyclical stocks have severely underperformed defensive stocks, future market returns tend to be somewhat better compared to periods of moderate cyclical underperformance (although still typically below the historical average). This improved market performance at extreme cyclical defensive performance differences reflects economic turning points, where investor sentiment and macroeconomic conditions begin to shift positively, prompting cyclical stocks to rebound. Such rebounds often signify the early stages of economic recovery, leading to improving market conditions and providing investors with opportunities to capitalize on an anticipated upswing in economic growth.
Conclusion
The evidence presented supports using the cyclical-defensive performance spread as a practical guide for tilting equity exposure through the cycle. The signal is intuitive, timely and rooted in company fundamentals, yet flexible enough to capture shifting leadership before macro data fully reflects the change. It does not eliminate uncertainty, and it will not be right at every juncture, but it has historically helped distinguish phases when risk-taking is rewarded from periods when capital preservation is prudent. Implemented with discipline, the approach can improve participation in expansions while reducing vulnerability in slowdowns, tightening the link between macro views and actual portfolio positioning.
Advisors can translate this insight into action with purpose-built building blocks. The Mackenzie Cyclical Tilt ETF, MCYC, provides targeted exposure to companies that tend to benefit when growth expectations improve. The Mackenzie Defensive Tilt ETF, MDEF, emphasizes resilient cash flows and business models that have historically offered ballast when conditions deteriorate. Used alongside a diversified core equity allocation, MCYC and MDEF create a transparent, modular framework for adjusting exposure as leadership changes, seeking to capture more upside in favorable phases and preserve capital when caution is warranted, all while maintaining consistency with client mandates and risk budgets.
Advisors who prefer a simple, observable proxy for the paper’s signal can monitor the live relative performance of MCYC versus MDEF. When MCYC begins to outperform and that leadership persists, it points to a pro-growth regime in which increasing cyclical exposure is often rewarded; when MDEF leads, it signals a defensive phase in which emphasizing stability and preserving capital becomes the priority. Tracking this relationship provides a practical dashboard that mirrors the research and turns market leadership into an actionable, repeatable process.
Multi-Asset Strategies Team’s investment views
Tactical summary
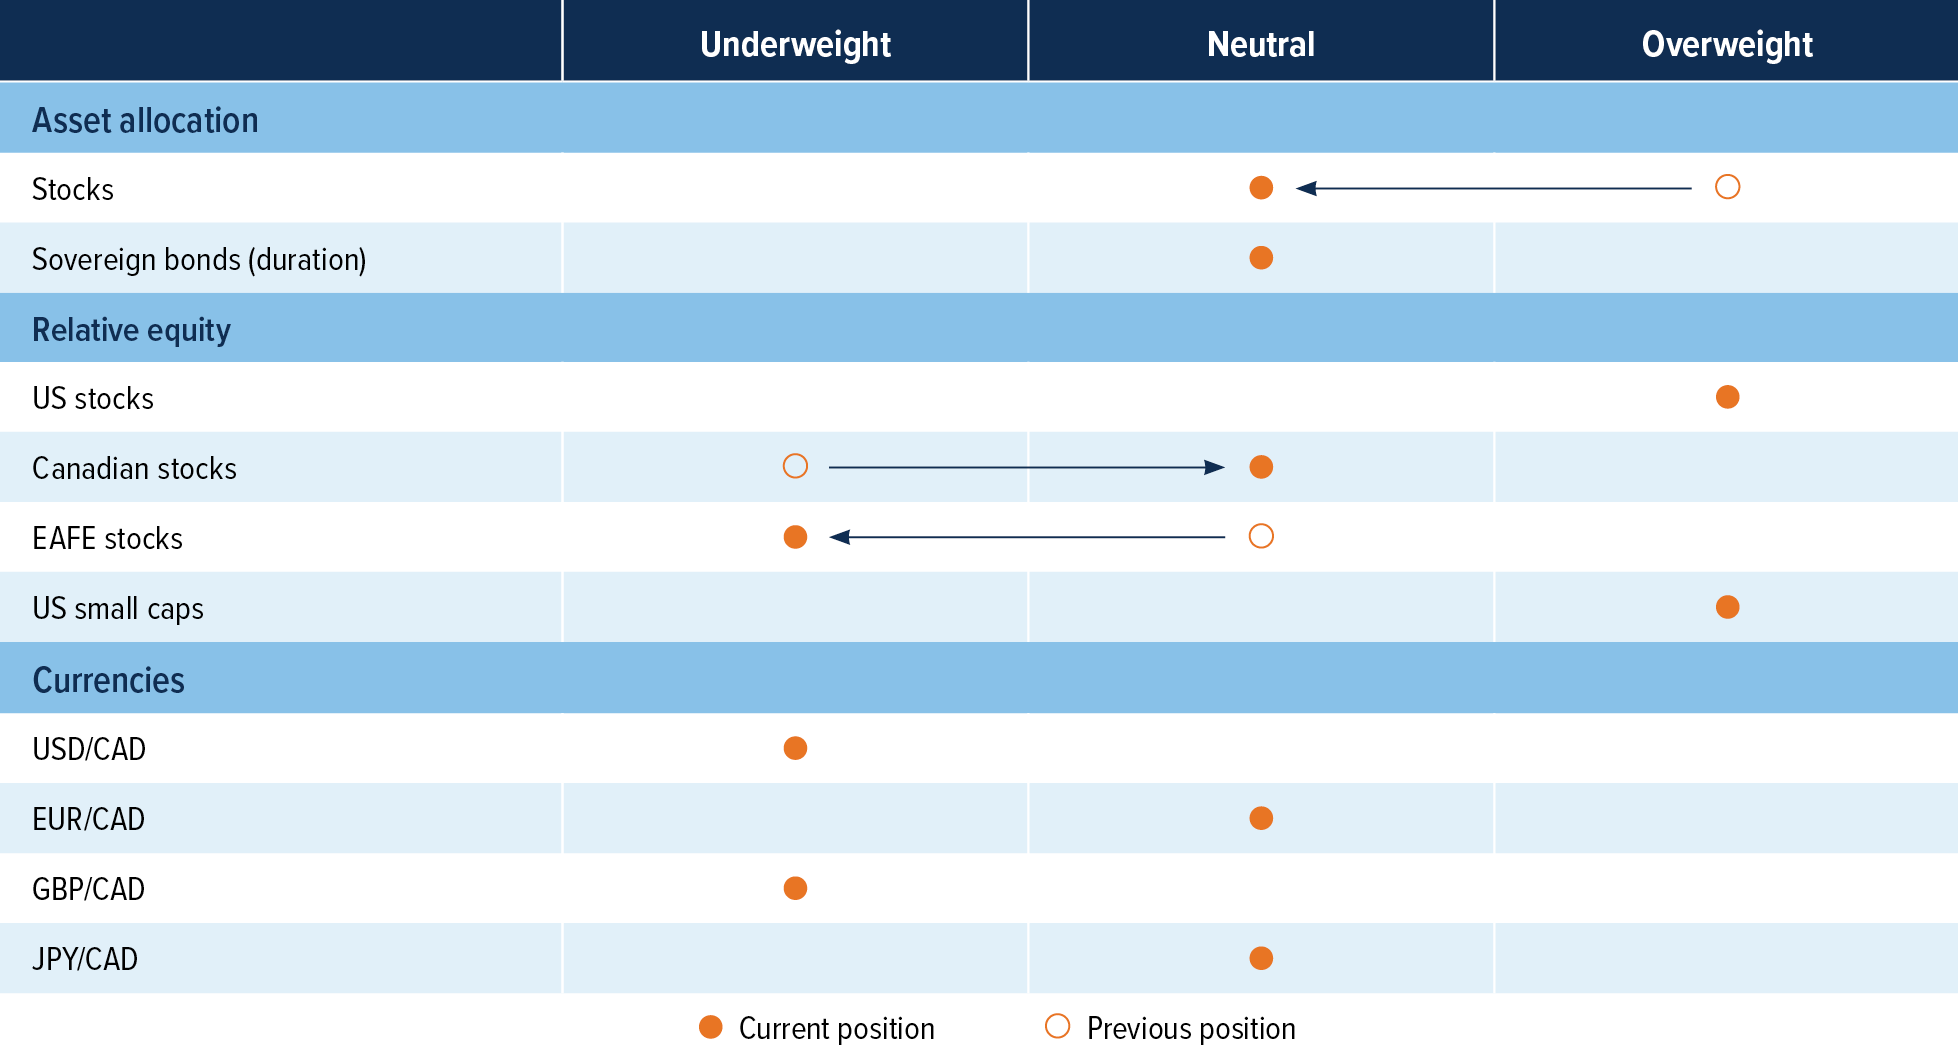
Source: Mackenzie Investments.
Note: The opinions expressed in this piece reflect short-term tactical views, which inform the positioning of some of the funds managed by the Multi-Asset Strategies Team.
Positioning highlights
Closing our stocks long: We are closing our equity overweight. Equities have rallied back to all-time highs after selling off in March. We remained overweight during this period until we saw a real impact on earnings. Since then, valuations look less attractive and economic forecasts have started to decrease, with the situation in the Strait of Hormuz remaining longer than initially thought. Even if the strait is opened soon, we believe oil prices will not decline to the level before the war, due to destruction of energy infrastructure in the Middle East.
Remain neutral on bonds: Bond yields rallied in March as central bank rate cuts were priced out of the markets due to higher inflation from higher oil prices due to the war in the Middle East. Bond yields remain elevated as the probability of an inflation shock from a longer protracted conflict in the Middle East remains.
Sell Europe and buy US: We were underweight Canada versus US, but higher energy prices from the conflict in the Middle East is beneficial for Canada and negative for Europe, as the eurozone imports oil from that region.
Currencies: USD remains overvalued, and our long-term view is for it to depreciate versus most developed countries. We continue to like CAD and JPY as the best play for this view. With oil up strongly in March, and holding in April, it should be supportive for Canada’s economy compared to other currencies.