The ETF Lab
ETF Spotlight: Four considerations on covered call ETFs
In recent years, covered call ETFs have seen a flurry of activity in terms of net flows and new launches, with now 100’s of ETFs in this category and a total AUM over $18 billion.
Covered call ETFs have been increasingly popular with many individual retail investors due in large part to the high target yields advertised on these ETFs. For investors whose chief investment objective is sourcing cash distributions from their investment portfolio, it may be suitable to allocate some portion of their portfolio to these ‘yield’ oriented products.
However, as we outline below, we believe there’s several material trade-offs that advisors should discuss with clients when considering these ETFs.
1) Total return trade-off
Covered call ETFs, simply put, involve writing call options on a certain percentage of the underlying holdings in the portfolio, which generates premium income helping to boost portfolio yields. However, the trade-off embedded in these products (versus investing simply in a portfolio of equities not using a covered call overlay) is that investors are potentially sacrificing longer term capital appreciation for short term cash distributions.
Below, we compare the total return of a broad, market cap weighted Canadian equity index ETF (QCN), a Canadian high dividend equity index ETF (ZDV) and a Canadian high dividend covered call ETF (ZWC). These ETFs have been highly correlated since common inception, with ZDV and ZWC having a correlation of 0.99, according to Morningstar based on daily returns.1
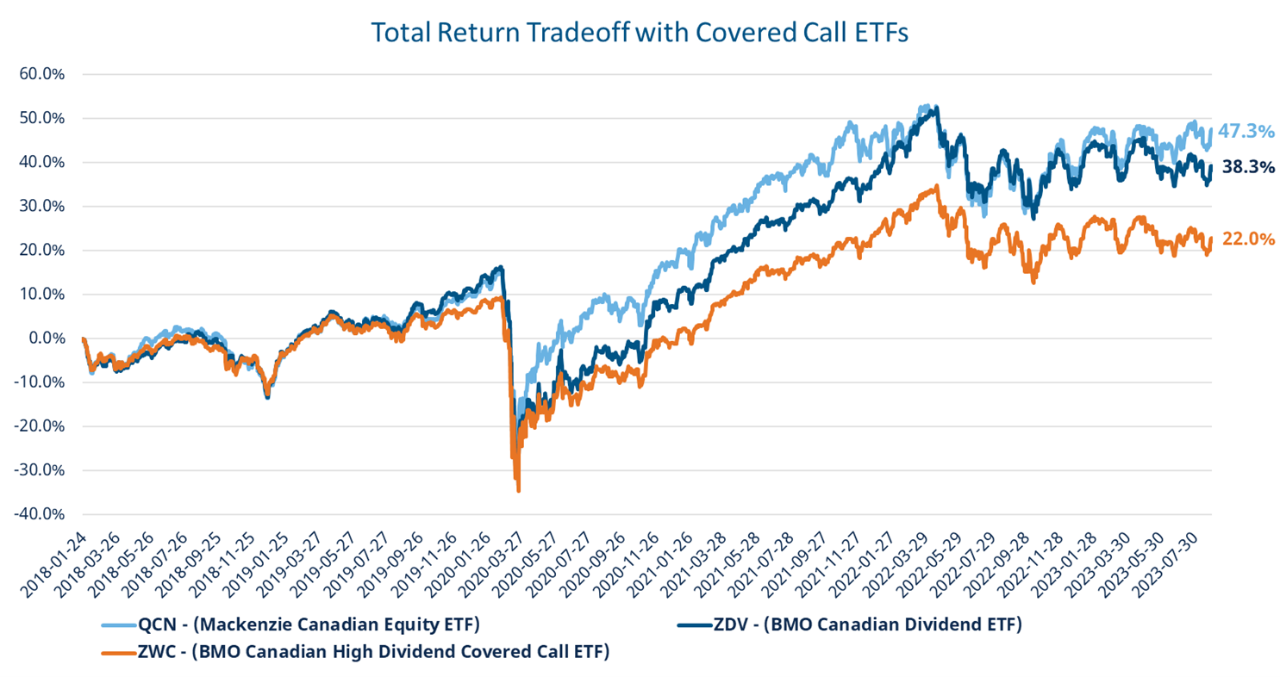 Source: Morningstar; period: 2018-01-25 to 2023-08-31.
Over the last roughly 5 years, the covered call strategy here has significantly underperformed on a total return basis, lagging both the market cap weighted broad market strategy and an index strategy with very similar portfolio holdings that doesn’t employ a covered call overlay.
2) Higher costs
Due to the operational complexities of executing a covered call strategy, these ETFs typically come with much higher MERs than broad market index strategies or other dividend focused, non-covered call ETFs.
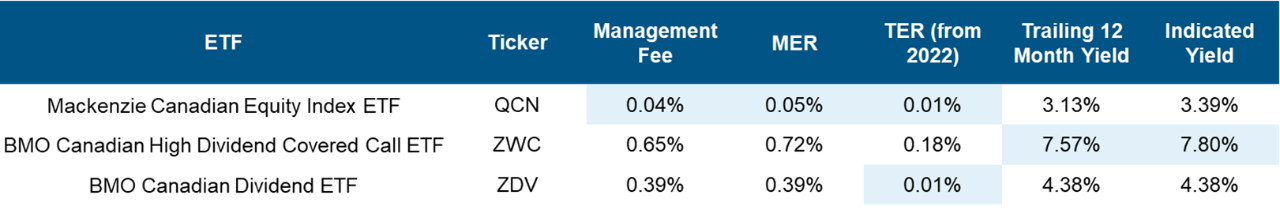 Source: Bloomberg; as of September 16, 2023
Additionally, covered call strategies have significantly higher trading costs, as indicated by a higher TER, which can act as an additional drag on performance.
3) NAV erosion
Total return comparisons, as shown in the chart above, compares the return experience assuming distributions are reinvested. However, many investors who are using covered call ETFs to source income from their investment portfolio are not reinvesting distributions. For these investors, it’s important to also consider the potential NAV erosion that can occur in these ETFs due to the high, typically fixed or very stable yield target.
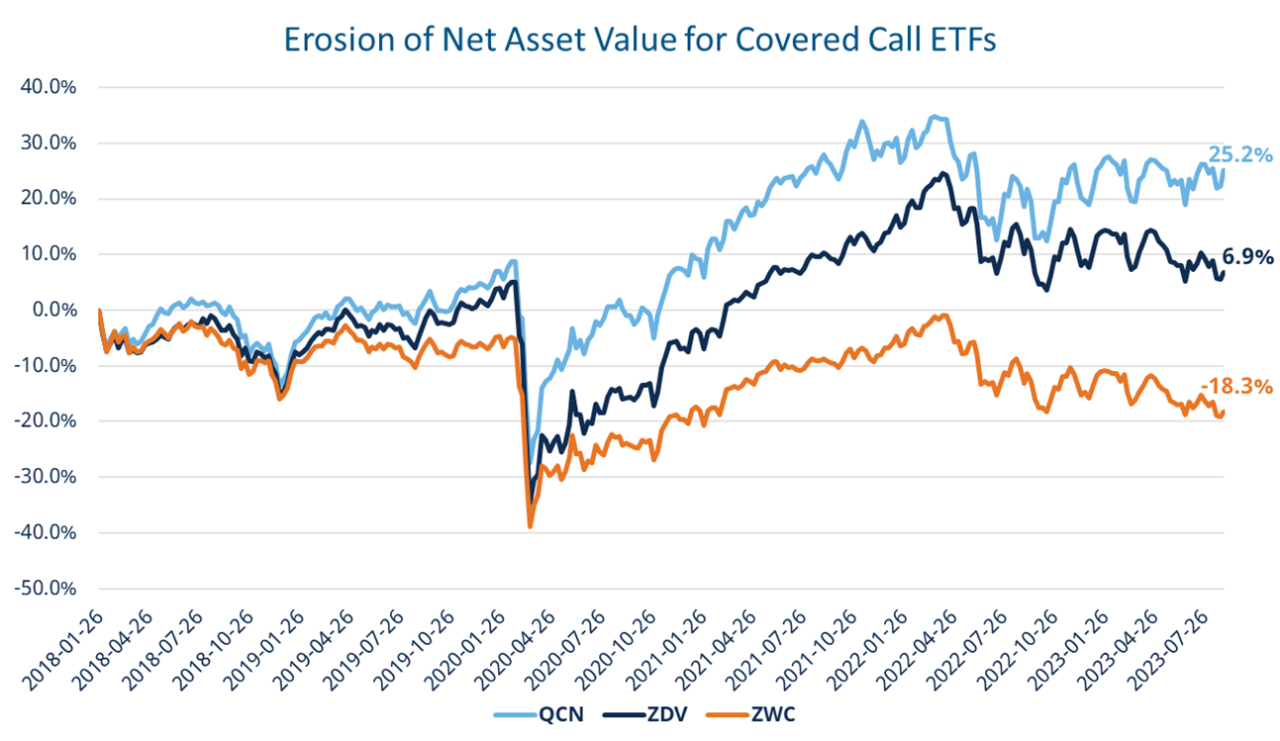 Source: Bloomberg; period: 2018-01-25 to 2023-08-31
Despite a very positive backdrop for Canadian equity investment returns, the covered call ETF here has seen its NAV shrink by over 18%. If the NAV of an ETF is declining over time, that means that even if the yield % remains stable, the income (dollar amount of the distribution) that investors receive will also decline. Conversely, investors whose capital has grown due to capital appreciation will also see their income from this ETF increase if the yield % remains stable.
4) Operational and tax complexities
There are several tax and operational complexities advisors should also consider when evaluating covered call ETFs. While volatility, measured by standard deviation, can be lower in some covered call ETFs, this is at least in part due to the upside appreciation that these strategies forego when writing call options. Alternative measures of volatility (such as downside deviation) typically show these products have similar levels of volatility as market cap weighted index strategies. While premium income can potentially offset some losses, it doesn’t provide downside protection that would be offered by buying puts for instance. Meanwhile, selling puts, as some options-based strategies have started to do in order to boost yields further, would potentially amplify losses in the event of steep declines in the underlying holdings.
Covered call ETF distributions are often made up of a significant percentage of return of capital. While return of capital isn’t taxed immediately, it does lower the adjusted cost base of one’s investment. This introduces a potential future tax liability if the ETF is held in a non-registered account.
Lastly, yields across covered call ETFs varies significantly, as does the degree of the trade-offs mentioned above. Longer tenured ETFs in this space came to market writing short dated, OTM call options on 20%-35% of the portfolio. In recent years, we’ve seen more and more ETFs come to market advertising double-digit yields, while writing ATM call options on 50% or more of the portfolio.
ETF News & Notes
Tax loss harvesting opportunities for Q4/2023
Tax loss harvesting is a method in which an investor realizes losses by selling securities that currently have a fair market value that is lower than its cost base. This strategy applies only to non-registered accounts.
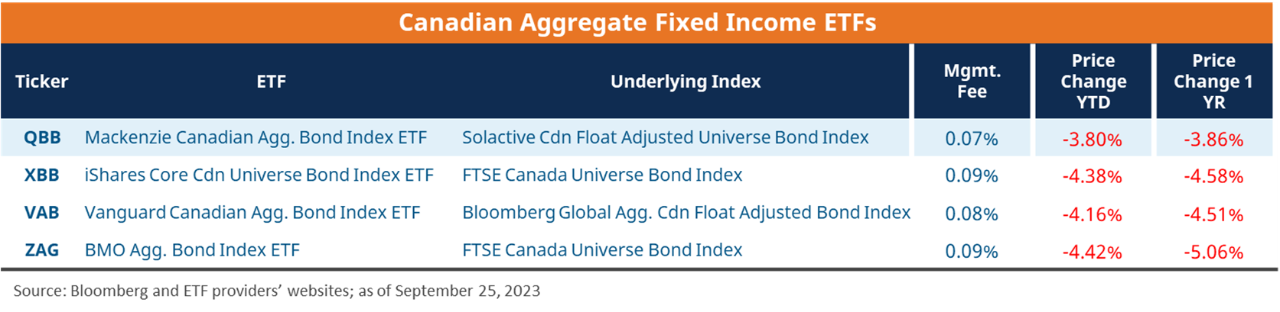
With government bond yields continuing to march higher, there may be some opportunities to employ a tax loss harvesting strategy on several fixed income positions (individual bonds, funds or ETFs).
As one example, consider Canadian aggregate bonds, where the YTD total return is down over 2%, while on a price basis, returns in ETFs that track this market vary from -3.8% to -4.4%. Of course, those who have held a Canadian aggregate bond ETF for longer than 2 years, very well may have an even greater opportunity to help offset capital gains elsewhere in the portfolio.
Look out for more information on this topic in the coming weeks.
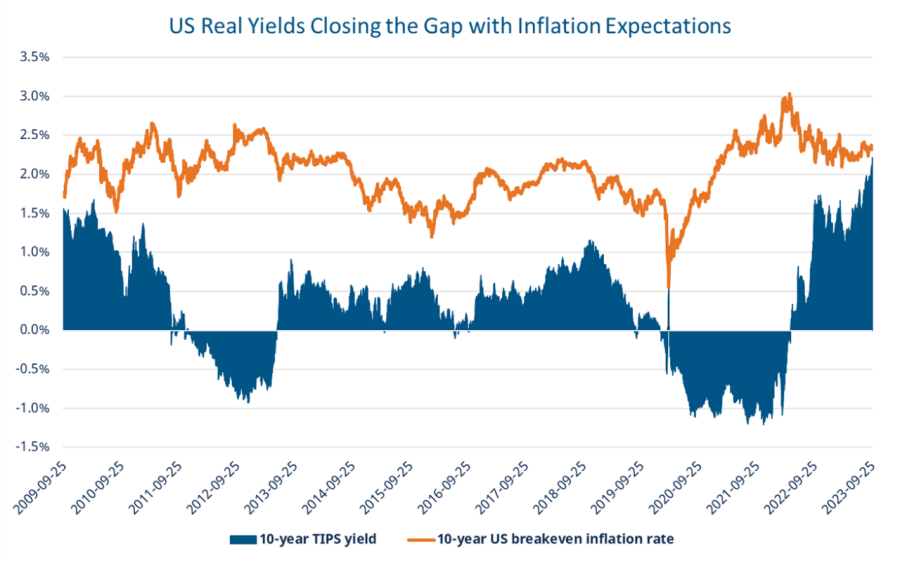
US real yields approaching expected inflation rate
Bloomberg noted this week that, as shown below, the US 10 Year TIPS yield is approaching the 10 YR breakeven inflation rate. QTIP – (Mackenzie US TIPS Index ETF (CAD-Hedged)), which tracks a diversified portfolio of US TIPS, has a real yield of 2.56%, after stripping out the effects of inflation.2
 Source: Bloomberg, Mackenzie Investments; as of September 26, 2023
Our view is that investors can consider a long-term strategic allocation to QTIP due to its potential to provide equity risk diversification, protection against upside surprises in inflation, and income.
ETF Flows Update
- Asset allocation ETFs had another strong week, adding nearly $130M in the week ending September 22nd. As of end of August, this category had added $1.2B in net creations.
- Canadian aggregate fixed income ETFs, despite negative total returns year-to-date, have continued to gather net inflows quarter-to-date. In 2023, this category has attracted the most assets, outside of money market ETFs, pulling in over $4 billion as of end of August.3
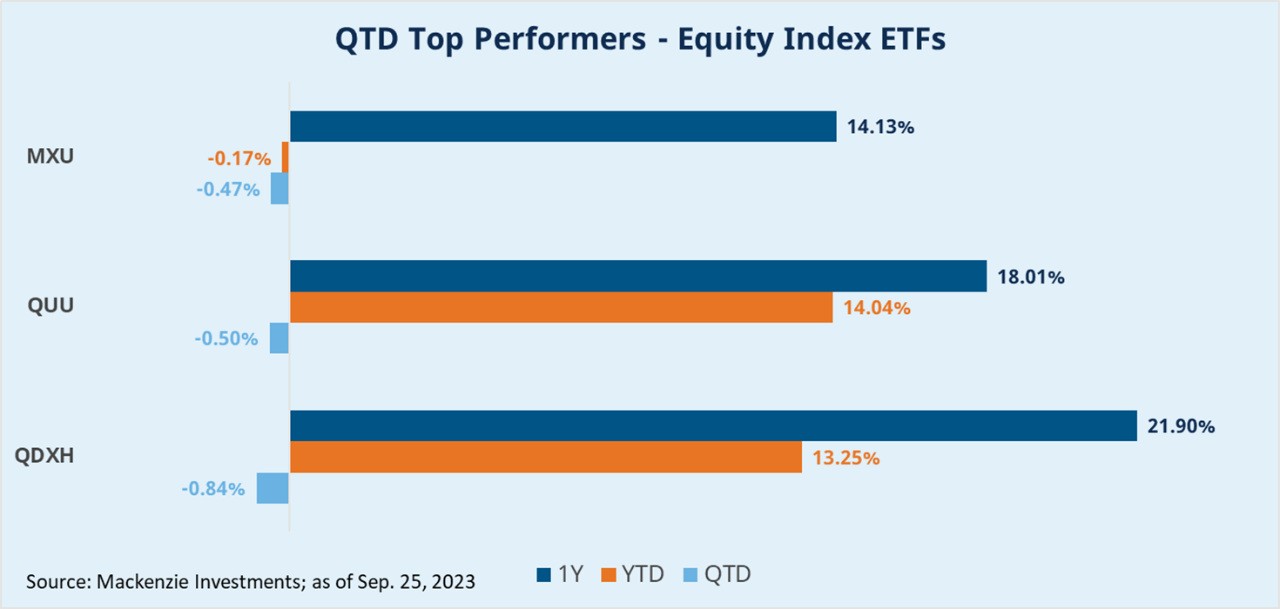
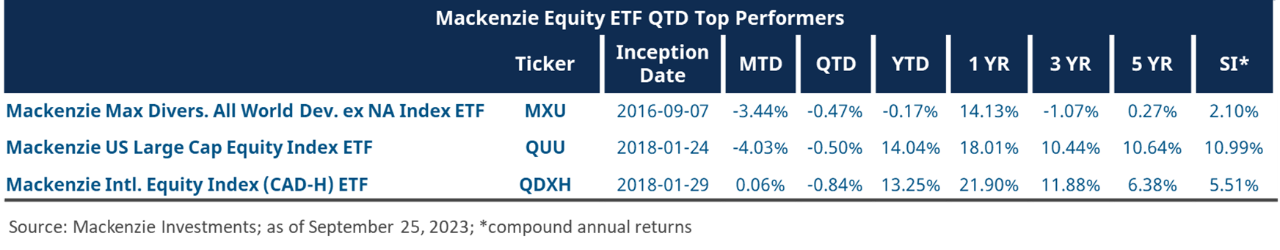
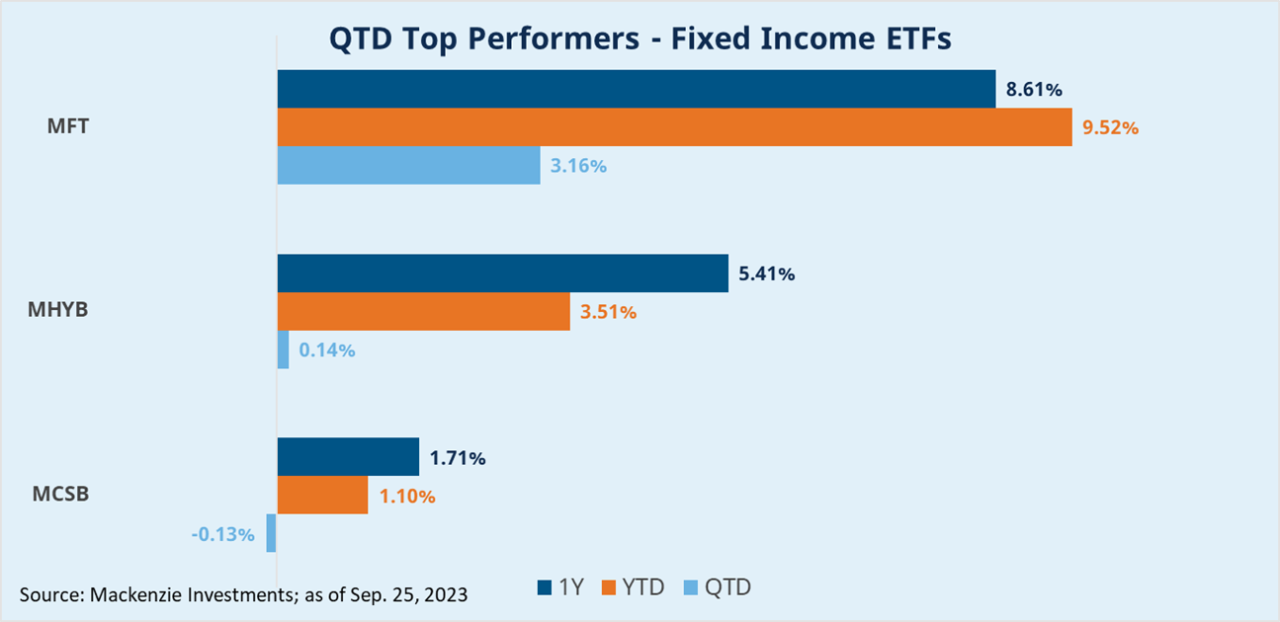
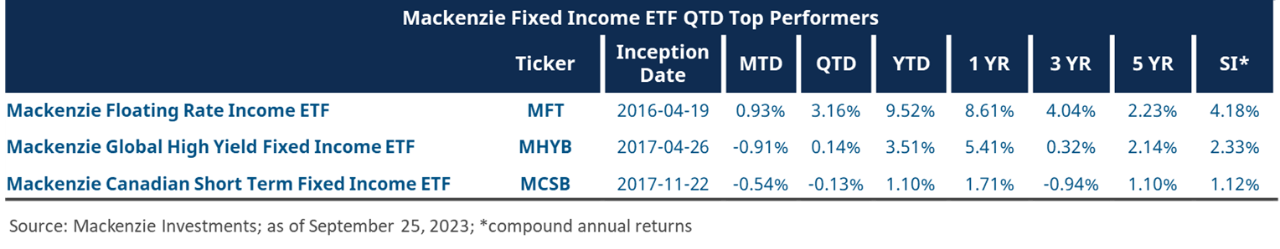
Mackenzie ETF Top Performers
Source:
1: Morningstar; period: 2018-01-25 to 2023-08-31
2: Bloomberg; as of September 26, 2023
3: Bloomberg, Mackenzie Investments
FOR ADVISOR USE ONLY. No portion of this communication may be reproduced or distributed to the public as it does not comply with investor sales communication rules. Mackenzie disclaims any responsibility for any advisor sharing this with investors.
Commissions, brokerage fees, management fees, and expenses all may be associated with Exchange Traded Funds. Please read the prospectus before investing. The indicated rates of return are the historical annual compounded total returns, including in share or unit value and reinvestment of distributions and does not take into account sales, redemption, distribution, or optional charges or income taxes payable by any securityholder that would have reduced returns. Exchange Traded Funds are not guaranteed, their values change frequently, and past performance may not be repeated.
The content of this article (including facts, views, opinions, recommendations, descriptions of or references to, products or securities) is not to be used or construed as investment advice, as an offer to sell or the solicitation of an offer to buy, or an endorsement, recommendation or sponsorship of any entity or security cited. Although we endeavour to ensure its accuracy and completeness, we assume no responsibility for any reliance upon it.
This article may contain forward-looking information which reflect our or third party current expectations or forecasts of future events. Forward-looking information is inherently subject to, among other things, risks, uncertainties and assumptions that could cause actual results to differ materially from those expressed herein. These risks, uncertainties and assumptions include, without limitation, general economic, political and market factors, interest and foreign exchange rates, the volatility of equity and capital markets, business competition, technological change, changes in government regulations, changes in tax laws, unexpected judicial or regulatory proceedings and catastrophic events. Please consider these and other factors carefully and not place undue reliance on forward-looking information. The forward-looking information contained herein is current only as of September 27, 2023. There should be no expectation that such information will in all circumstances be updated, supplemented, or revised whether as a result of new information, changing circumstances, future events or otherwise.
Index performance does not include the impact of fees, commissions, and expenses that would be payable by investors in the investment products that seek to track an index.