Monthly commentary - Mackenzie Fixed Income Team

IN THIS ARTICLE min read
Written by the Mackenzie Fixed Income Team
Key Highlights
- Central bank guidance remains largely status quo, with the Fed signaling one cut this year, limited forward guidance, and growing divergence across major central banks.
- Canadian macro risks are skewed to the downside, as weakening growth, negative population momentum, housing adjustment, and softer labor indicators limit scope for further tightening.
- BoC’s dovish tilt highlights demand-side fragility, suggesting energy price shocks are less likely to feed through to sustained inflation given excess supply conditions.
- Positioning favors Canadian duration over U.S., reflecting downside growth risks, housing and labor softening, and limited scope for further BoC tightening; modest long exposure added in the 10‑year sector.
- Risk exposure is selective and tactical, with neutral U.S. duration, intermediate‑curve bias globally, incremental high‑yield additions to reduce cash drag, and preference for higher‑quality credits amid uncertain catalysts.
Fixed Income Team Views
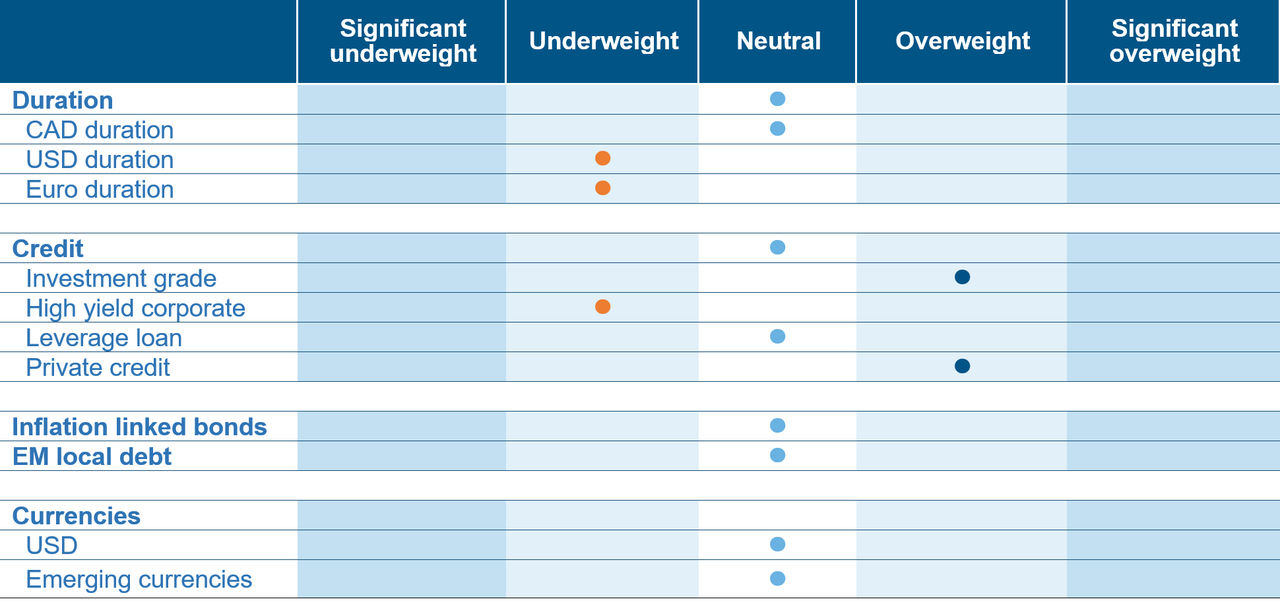 Source: Mackenzie Investments. As of March 31, 2026.
Fixed Income Market Update
Recent central bank communications were broadly consistent with expectations. The latest Fed meeting was largely uneventful, with policy unchanged and the median projection still indicating a single cut this year. While there has been some discussion around the possibility of no cuts in 2026, the press conference offered little in the way of new guidance. Chair Powell also indicated he expects to remain in place until a successor is confirmed, potentially extending his tenure into the summer.
Market pricing remains volatile. Fed rate expectations have flattened materially, while the market is now pricing rate hikes for Canada, an outcome we continue to view skeptically. Elsewhere, the Bank of Japan maintained a cautious stance.
The Bank of Canada meeting was more notable in its tone. While policy was left unchanged, the statement placed greater emphasis on downside growth risks than on upside inflation risks, suggesting increased concern around aggregate demand and excess supply in the economy. This framing supports the view that rising energy prices may not translate one-for-one into inflation pressure.
After an extended period of population-driven demand, Canada has now experienced consecutive quarters of population decline, largely reflecting a sharp reversal in temporary resident inflows. This shift is already evident in housing fundamentals, particularly in the rental market, where weaker demand is colliding with a record level of supply under construction.
Housing prices continue to adjust across regions, notably in single-family and condominium segments. Elevated inventories, subdued transaction volumes, and rising power-of-sale activity underscore the depth of the ongoing correction. At the same time, reduced housing starts point to a materially constrained supply pipeline over the medium term. The mortgage renewal cycle remains a key focus for 2026, as a large cohort transitions from historically low interest rates to materially higher levels. While the adjustment has so far been absorbed, the bulk of renewals still lies ahead, suggesting continued pressure on household cash flows and housing-related activity in the year ahead.
Recent geopolitical escalation and the associated surge in energy prices have driven a differentiated response across emerging market currencies. While risk sentiment deteriorated broadly, EM FX performance has been uneven, with several currencies displaying relative resilience against the Canadian dollar, which has lagged within G10. Framing EM exposures versus CAD has therefore provided a partial offset to broader U.S. dollar strength.
Fund Positioning
Our positioning reflects a cautious macro outlook, with the highest conviction centered on Canada. We remain moderately bearish on the Canadian economy, driven by weaker relative growth versus the U.S., ongoing housing adjustment, and a labor market that appears softer when viewed through firm‑level data (SEPH) rather than headline employment. Population growth has turned negative, which is beginning to weigh on rental activity and household consumption, reinforcing our view that domestic demand will remain subdued. Given downside growth risks and ongoing USMCA uncertainty, we see limited scope for further tightening and believe the balance of risks favors rate cuts later this year. Against this backdrop, we prefer Canadian duration over U.S. duration and have added modest exposure in the 10‑year sector, while keeping overall duration sizing measured.
Globally, duration exposure has been concentrated around the intermediate part of the curve. While we briefly moved to a long position in US treasuries in mid-March to hedge against a potential growth shock, we have since returned to a neutral stance as inflation risks became the primary market driver. The divergence in central bank responses to stagflationary risks, coupled with the ongoing support from U.S. business investment including substantial AI capex expected and fiscal shifts toward defense in Europe, creates significant relative value opportunities. In our view, the lack of visibility regarding Middle East negotiations necessitates a disciplined and tactical approach to portfolio management identifying the right opportunities and monitoring and hedging risks. We remain prepared to adjust duration and risk allocations as we navigate the path forward.
While in private credit, incremental liquidity and renewed transaction activity are helping contain stress and delay the emergence of broader cracks. While we still have concerns related to risk sentiment and contagion, investors are increasingly focused on the absence of an imminent catalyst for dislocations to occur.
We have been adding selectively to high yield exposure and reducing cash levels in the high yield funds. We do not see a compelling case for materially tighter spreads from current levels, but absent a clear shock, it is also difficult to argue for a meaningful widening. As a result, we believe it makes sense to reduce cash drag while maintaining a disciplined, selective approach and a continued bias toward higher-quality exposure within high yield.
Central Bank Watch
Region | Latest CPI Inflation | Policy rate | Latest policy action | Next decision date | Market expectation | Outlook |
Canada | 1.80% | 2.25% | No change | 29-Apr-26 | No change | Neutral |
United States | 3.30% | 3.75% | No change | 29-Apr-26 | No change | Underweight |
Eurozone | 2.60% | 2.15% | No change | 30-Apr-26 | No change | Underweight |
Japan | 1.30% | 0.75% | No change | 28-Apr-26 | No change | Underweight |
Australia | 3.20% | 3.60% | No change | 05-May-26 | No change | Overweight |
Credit Market Performance
The yield on the high yield market represents an attractive source of income and has risen from the 2021 lows to the high single-digit range and currently stands at 7.4% as of March 31, 2026. The average price of a high yield bond has declined to a current price of $96.18. Majority of these bonds will continue to make their coupon payments and mature in the future at a price of $100, representing an attractive capital gain opportunity for investors that are willing and able to do the deeper analysis required in the high yield market.
The majority of the high yield market issuer fundamentals are strong, as companies were able to refinance debt and extend out maturities at attractive yield levels prior to the beginning of the rate hiking cycle. With reasonable leverage, and strong interest coverage ratios, we see limited risks related to covenants, liquidity or refinancing needs for higher quality companies that continue to have access to the capital markets.
Although private credit continues to make headlines, we are confident in our relatively small allocation to top-tier managers that have maintained discipline and differentiation vs. peers, generating strong performance with limited impairments given the low software/technology exposure.
Index | Yield | Yield m/m | Spread | Spread m/m | Performance (%) | |||
bp | bp | bp | 1m | 3m | YTD | 1Y | ||
Investment Grade | ||||||||
CA | 4.2% | 40 | 93 | 2 | -1.8 | 0.3 | 0.25 | 2.8 |
US | 5.2% | 40 | 90 | 4 | -2.0 | -0.4 | -0.4 | 4.8 |
High Yield |
|
|
|
|
|
|
|
|
CA | 7.1% | 46 | 314 | 26 | -1.5 | -0.7 | -0.7 | 5.9 |
US | 7.7% | 44 | 349 | 18 | -1.2 | -0.6 | -0.6 | 6.9 |
US Leverage Loans | 8.3% | -2 | 445 | -2 | 0.5 | -0.6 | -0.6 | 4.8 |
Source: Bloomberg as of March 31, 2026, performance is reflective of local returns.
Commissions, trailing commissions, management fees, and expenses all may be associated with mutual fund investments. Please read the prospectus before investing. The indicated rates of return are the historical annual compounded total returns as of Mar 31, 2026, including changes in share value and reinvestment of all distributions and does not take into account sales, redemption, distribution, or optional charges or income taxes payable by any security holder that would have reduced returns. Mutual funds are not guaranteed, their values change frequently, and past performance may not be repeated.
Index performance does not include the impact of fees, commissions, and expenses that would be payable by investors in investment products that seek to track an index.
This document may contain forward-looking information which reflect our or third party current expectations or forecasts of future events. Forward-looking information is inherently subject to, among other things, risks, uncertainties and assumptions that could cause actual results to differ materially from those expressed herein. These risks, uncertainties and assumptions include, without limitation, general economic, political and market factors, interest and foreign exchange rates, the volatility of equity and capital markets, business competition, technological change, changes in government regulations, changes in tax laws, unexpected judicial or regulatory proceedings and catastrophic events. Please consider these and other factors carefully and not place undue reliance on forward-looking information. The forward-looking information contained herein is current only as of Mar 31, 2026. There should be no expectation that such information will in all circumstances be updated, supplemented or revised whether as a result of new information, changing circumstances, future events or otherwise.
The content of this commentary (including facts, views, opinions, recommendations, descriptions of or references to, products or securities) is not to be used or construed as investment advice, as an offer to sell or the solicitation of an offer to buy, or an endorsement, recommendation or sponsorship of any entity or security cited. Although we endeavour to ensure its accuracy and completeness, we assume no responsibility for any reliance upon it.
All information is historical and not indicative of future results. Current performance may be lower or higher than the quoted past performance, which cannot guarantee results. Share price, principal value, and return will vary, and you may have a gain or a loss when you sell your shares. Performance assumes reinvestment of distributions and does not account for taxes. Performance may not reflect any expense limitation or subsidies currently in effect. Short-term trading fees may apply.
This material is for informational and educational purposes only. It is not a recommendation of any specific investment product, strategy, or decision, and is not intended to suggest taking or refraining from any course of action. It is not intended to address the needs, circumstances, and objectives of any specific investor. Mackenzie Investments, which earns fees when clients select its products and services, is not offering impartial advice in a fiduciary capacity in providing this sales and marketing material. This information is not meant as tax or legal advice. Investors should consult a professional advisor before making investment and financial decisions and for more information on tax rules and other laws, which are complex and subject to change.
The rate of return is used only to illustrate the effects of the compound growth rate and is not intended to reflect future values of the mutual fund or returns on investment in the mutual fund.