
Written by the Mackenzie Fixed Income Team
Key Highlights
- FOMC minutes signal caution and division, with limited data visibility reinforcing a likely hawkish cut now and a pause in 2026.
- Fiscal credibility emerges as a global risk driver, with U.S. tariff-funded payment proposals and Japan’s stimulus fueling long-end volatility and repricing risks.
- Canada inflation eases to 2.2%, but structural headwinds like housing stress, immigration slowdown and trade uncertainty support rate cuts in 1H 2026.
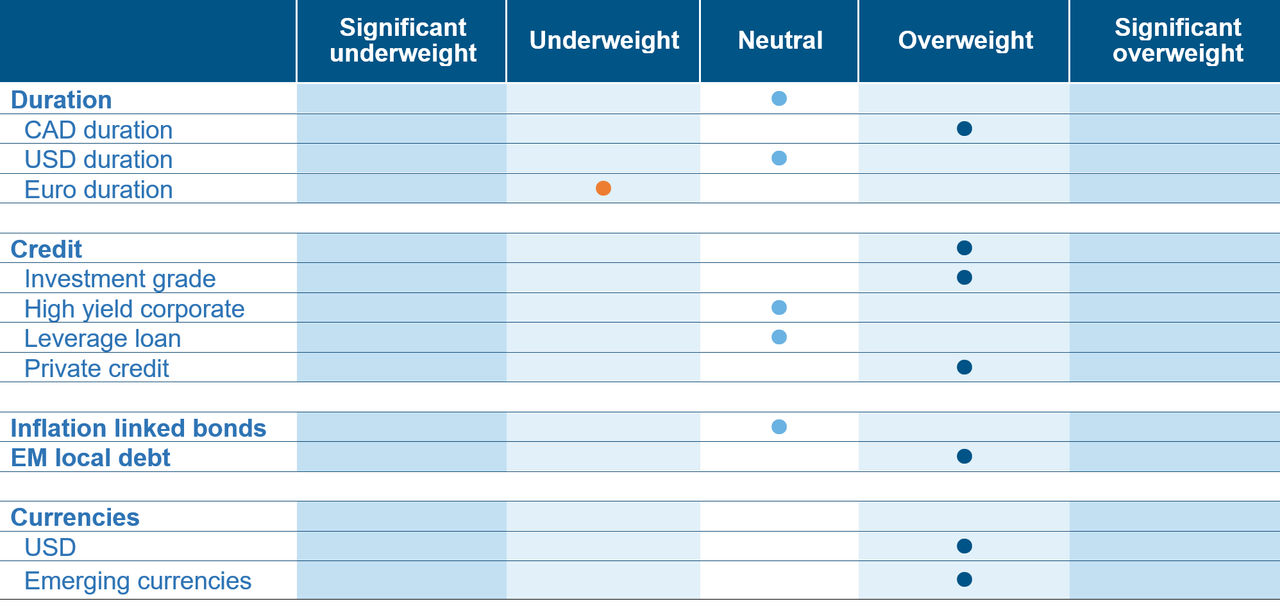
- Neutral stance on U.S. duration, reflecting uncertainty around Fed timing and fiscal-driven volatility at the long end while short-end Canada positioning prioritized, as market pricing underestimates structural headwinds and the likelihood of rate cuts by mid-2026.
- Portfolio positioning favors EM carry trades and selective curve plays, while remaining neutral on U.S. duration amid fiscal-driven yield volatility.
Fixed Income Team Views
 Source: Mackenzie Investments. As of November 30, 2025.
Fixed Income Market Update
Recent minutes from the October FOMC meeting underscore a cautious stance amid limited visibility, echoing the ‘driving in fog’ analogy. The committee appears increasingly divided, with distinct camps favoring either rate cuts or holding steady. Labor market data adds complexity: September payrolls rose by 119,000, but downward revisions and an uptick in unemployment to 4.44% point to softening conditions. With incomplete October and November data due to reporting delays, policy decisions will rely on partial information, reinforcing the likelihood of a hawkish cut now and a pause in 2026 as the cycle stabilizes.
Proposals to distribute direct payments funded by tariff revenues highlight a growing fiscal theme. While full implementation appears unlikely, even partial measures could widen the deficit and trigger market sensitivity at the long end of the curve. Such developments risk repricing across fixed income and spillovers into credit and equities, underscoring how fiscal credibility has become a key determinant of global risk sentiment.
Japan’s push for aggressive infrastructure spending and tax cuts has accelerated upward pressure on JGB yields and fueled speculation of currency intervention as USD/JPY trades near multi-year highs. This reinforces a broader trend: markets are increasingly penalizing perceived fiscal excess, a dynamic evident since the UK gilt episode in 2022. Similar risks loom across developed markets, making fiscal credibility a central macro driver.
Domestic inflation in Canada eased to 2.2% on headline measures, with core metrics also softer, though shelter costs remain firm. Despite recent strong employment prints, underlying trends suggest fragility. October gains were concentrated in part-time roles, likely linked to temporary factors. Policy rates are expected to hold near term, but structural headwinds such as housing affordability, immigration slowdown, and trade uncertainty, support the case for cuts in the first half of 2026, in our view. Current market pricing underestimates this risk, leaving short-end Canadian rates positioned for adjustment.
Fund Positioning
In North America, the focus shifts to short-end Canadian rates, where market pricing underestimates the likelihood of policy easing. Current expectations imply minimal downside risk for the Bank of Canada, yet structural headwinds—housing stress, immigration slowdown, and trade uncertainty suggest cuts by mid-2026. This disconnect creates an opportunity to position via receiver swaps or short-duration instruments, capturing potential repricing opportunities as the curve adjusts lower.
The strategy is deliberately neutral on U.S. duration, reflecting uncertainty around Fed timing and the risk of fiscal-driven yield volatility at the long end. Spread compression trades (e.g., long U.S. vs short Canada) that dominated earlier in the year have largely been unwound, shifting emphasis toward selective curve plays rather than outright directional bets.
The dominant strategy revolves around exploiting carry opportunities in emerging markets, where real yields remain exceptionally attractive. Countries such as Brazil, Mexico, South Africa, and Peru feature policy rates far above inflation, creating a meaningful real yield differential. This environment allows investors to earn substantial income while maintaining exposure to relatively stable macro conditions. The approach often combines local rate positions with FX exposure for enhanced return potential. These trades have contributed meaningfully to portfolio performance across global and unconstrained mandates. If U.S. rates and the dollar remain broadly stable, the global backdrop supports carry-rich environments, making these positions resilient unless a significant risk-off shock materializes.
A broader thematic overlay is critical, in that the fiscal credibility has become a global macro driver, influencing bond markets in developed economies as much as emerging ones. This informs a cautious stance on long-end exposure in regions where fiscal overspend perceptions could trigger sharp repricing, as seen in Japan and previously in the UK.
Central Bank Watch
Region | Latest CPI Inflation | Policy rate | Latest policy action | Next decision date | Market expectation | Outlook |
Canada | 2.20% | 2.25% | No change | 28-Jan-26 | No change | Overweight |
United States | 3.00% | 3.75% | 25 bp cut | 29-Jan-26 | No change | Neutral |
Eurozone | 2.10% | 2.15% | No change | 18-Dec-25 | No change | Underweight |
Japan | 3.00% | 0.50% | No change | 19-Dec-25 | No change | Underweight |
New Zealand | 3.00% | 2.25% | 25 bp cut | 17-Feb-26 | No change | Neutral |
Credit Market Performance
High-yield bond spreads were volatile in November as markets navigated shifting expectations for the December Fed meeting, the longest U.S. government shutdown in history, a strong earnings season, and a dip followed by recovery in equities. Single-B rated bonds led performance with a +0.80% monthly gain, ahead of BBs at +0.67%, while CCCs declined -0.40%. From a sector perspective, Autos (+1.51%) and Media (+1.20%) outperformed, whereas Technology lagged at -0.21%, compared to the overall HY index return of +0.57%. Decompression trends that began in October persisted, with CCC credits posting a second consecutive monthly loss. Inflows returned by month-end, and capital market activity strengthened, with issuance rising to $24.9 billion in November, up from October. Meanwhile, the third-quarter HY earnings season was robust, though sector-level dispersion remained elevated.
The loan market in November displayed a clear bifurcation. High-quality, performing loans remained well bid, while lower-quality credits faced persistent weakness, pulling down the overall average loan price for the month. From a ratings perspective, higher-rated loans, particularly BBB and BB outperformed, as did benchmark loans. Technicals remained robust, supported by strong CLO formation despite ongoing retail outflows. This trend has favored issuers for much of the past three years. Defaults remain contained. The Chapter 11 trailing 12-month default rate declined to 1.25% by principal amount and 1.26% by borrower count, excluding liability management exercises (LMEs), which now represent two-thirds of defaults. The combined default rate (Chapter 11 + LMEs) fell to 3.7% from 4.2% in October. Recoveries, however, remain at record lows, driven by structural shifts such as cov-lite documentation, prevalence of LMEs, and the rise of asset-light sectors.
Index | Yield | Yield m/m | Spread | Spread m/m | Performance (%) | |||
bp | bp | bp | 1m | 3m | YTD | 1Y | ||
Investment Grade | ||||||||
CA | 3.84% | -1 | 93 | 0 | 0.3 | 2.5 | 5.0 | 5.0 |
US | 4.82% | -5 | 82 | 2 | 0.4 | 2.5 | 8.12 | 6.2 |
High Yield |
|
|
|
|
|
|
|
|
CA | 6.75% | 7 | 263 | 0 | 0.5 | 1.6 | 7.2 | 7.0 |
US | 7.13% | -4 | 292 | -2 | 0.4 | 1.5 | 7.8 | 7.3 |
US Leverage Loans | 8.06% | -3 | 399 | 5 | 0.4 | 1.0 | 5.2 | 5.8 |
Commissions, trailing commissions, management fees, and expenses all may be associated with mutual fund investments. Please read the prospectus before investing. The indicated rates of return are the historical annual compounded total returns as of November 30, 2025, including changes in share value and reinvestment of all distributions and does not take into account sales, redemption, distribution, or optional charges or income taxes payable by any security holder that would have reduced returns. Mutual funds are not guaranteed, their values change frequently, and past performance may not be repeated. Index performance does not include the impact of fees, commissions, and expenses that would be payable by investors in the investment products that seek to track an index.
Index performance does not include the impact of fees, commissions, and expenses that would be payable by investors in investment products that seek to track an index.
This document may contain forward-looking information which reflect our or third party current expectations or forecasts of future events. Forward-looking information is inherently subject to, among other things, risks, uncertainties and assumptions that could cause actual results to differ materially from those expressed herein. These risks, uncertainties and assumptions include, without limitation, general economic, political and market factors, interest and foreign exchange rates, the volatility of equity and capital markets, business competition, technological change, changes in government regulations, changes in tax laws, unexpected judicial or regulatory proceedings and catastrophic events. Please consider these and other factors carefully and not place undue reliance on forward-looking information. The forward-looking information contained herein is current only as of November 30, 2025. There should be no expectation that such information will in all circumstances be updated, supplemented or revised whether as a result of new information, changing circumstances, future events or otherwise.
The content of this commentary (including facts, views, opinions, recommendations, descriptions of or references to, products or securities) is not to be used or construed as investment advice, as an offer to sell or the solicitation of an offer to buy, or an endorsement, recommendation or sponsorship of any entity or security cited. Although we endeavour to ensure its accuracy and completeness, we assume no responsibility for any reliance upon it.
All information is historical and not indicative of future results. Current performance may be lower or higher than the quoted past performance, which cannot guarantee results. Share price, principal value, and return will vary, and you may have a gain or a loss when you sell your shares. Performance assumes reinvestment of distributions and does not account for taxes. Performance may not reflect any expense limitation or subsidies currently in effect. Short-term trading fees may apply.
This material is for informational and educational purposes only. It is not a recommendation of any specific investment product, strategy, or decision, and is not intended to suggest taking or refraining from any course of action. It is not intended to address the needs, circumstances, and objectives of any specific investor. Mackenzie Investments, which earns fees when clients select its products and services, is not offering impartial advice in a fiduciary capacity in providing this sales and marketing material. This information is not meant as tax or legal advice. Investors should consult a professional advisor before making investment and financial decisions and for more information on tax rules and other laws, which are complex and subject to change.
The rate of return is used only to illustrate the effects of the compound growth rate and is not intended to reflect future values of the mutual fund or returns on investment in the mutual fund.