
Written by the Mackenzie Fixed Income Team
Key Highlights
- US Treasuries rallied on safe-haven demand following the US strike on Iran’s nuclear facilities. Oil prices initially surged on fears of retaliation but reversed sharply after Iran’s response was seen as symbolic.
- Despite new US tariffs, recent CPI prints show limited impact due to importers front-loading inventories. This has delayed the pass-through to consumer prices, muting inflationary effects for now.
- Long-dated bonds globally are under pressure due to fiscal concerns, especially in the UK and Japan. Meanwhile, the Canadian economy is weakening, supporting the case for rate cuts, while US Treasuries remain favored for their relative value.
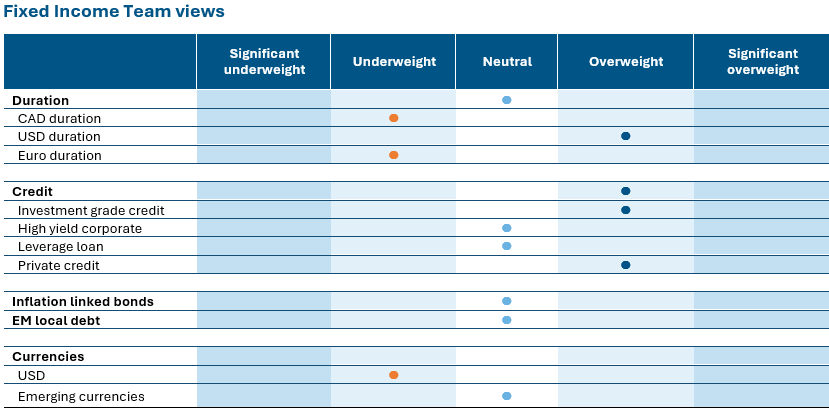
- The portfolio is overweight US duration (especially 10Y) and New Zealand bonds, underweight Canadian, European, and Japanese government bonds. Emerging markets like Mexico, Brazil, and Indonesia are favored for their proactive monetary policy and carry/currency appeal.
 Source: Mackenzie Investments. As of June 30, 2025.
Fixed Income Market Update
US Treasuries were well bid marked by risk aversion resulting from the escalation of the Middle East crisis and mild inflation prints, laying grounds for potential rate cuts. The US struck Iran’s nuclear facilities exacerbating the widening in near term geopolitical risk. Oil futures saw an immediate spike higher by 15% on a potential strong retaliation from Iran including the closure of the Strait of Hormuz, a key energy corridor, reigniting inflationary fears. However, what was not to be, Iran’s retaliation was deemed weak, measured, and symbolic which meant a sharp pull back lower for oil prices and (re)focus on economic data. The treasuries remained supported by dovish comments from Fed members - Bowman and Waller pushing for a rate cut if inflation data continues to improve, growing expectations that the Fed may pivot from its ‘wait and see’ approach sooner than earlier expected. While the US tariff measures were expected to influence inflation data more visibly by now, the impact has been relatively muted in recent CPI prints. This is largely due to the well-telegraphed nature of the policy, which allowed importers to front-load inventories ahead of implementation. As a result, the pass-through to consumer prices has been delayed, with businesses gradually working through pre-tariff stockpiles. We expect US rates markets to continue to focus on realized economic data on labour market and inflation, while the long end of the yield curve continues to reflect concerns over fiscal sustainability.
Super-long bonds around the world are under intense scrutiny this year, with investors demanding increasingly high yields as governments go deeper into deficit amid a myriad of concerns including the outlook for higher spending in Germany and a structural decline in demand for long Japanese government bonds and UK gilts. Yields on long-dated UK gilts surged as speculation over the future of Chancellor of the Exchequer Rachel Reeves reignited concerns about the nation’s fiscal position.
The resilience that the Canadian economy was previously showing in the face of US tariffs and related uncertainty seems to be fading with a higher rising unemployment and weaker economic growth, keeping afloat the possibility of a couple rate cuts for the rest of the year.
Fund Positioning
In the current fixed income landscape, our strategy is expressed by being overweight portfolio duration in US treasuries and underweight in Canadian government bonds reflecting differences in treasury bond valuations as well as the headroom for central bank to cut rates. The overweight US duration expressed on the 10Y curve contributed with a return of 1.6% vs - 0.3% in CA.
Within our global portfolios, we remain underweight with our exposure towards Europe and Japan where the negotiations and implications of tariffs and defense spending are still evolving. The ECB has lowered borrowing costs eight times since June 2024 but is now expected to hold at its next monetary-policy meeting later this month. With inflation now on target, economists predict one more cut this year. The BOJ seems to continue looking for further opportunities to raise rates even after the prospects for a trade deal with the US appeared to recede after Trump floated the idea of increasing tariffs to 35%, compared with a previous plan to hike an across-the-board duty to 24%.
We remain overweight duration in NZ bonds, which due to its fiscal sustainability are a much better place for investors looking to diversify out of US treasuries, relative to other developed markets. The timing of the next 25 bp cut will depend on how the RBNZ weighs near-term growth risks against short-term inflation. Emerging markets are undergoing a structural positive shift, particularly in countries with strong macroeconomic fundamentals and proactive central banks. What sets these markets apart is the decisive action taken by central banks—such as those in Mexico, Brazil, and Indonesia—which moved early and aggressively to hike policy rates in response to inflationary pressures. This proactive stance not only reinforces their credibility but also enhances their appeal from both a carry and currency trade perspective.
Central Bank Watch
Region | Latest CPI inflation | Policy rate | Latest policy action | Next decision date | Market expectation | Outlook |
Canada | 1.70% | 2.75% | No change | July 30, 2025 | No change | Underweight |
United States | 2.40% | 4.50% | No change | July 30, 2025 | No change | Overweight |
Eurozone | 2.00% | 2.15% | 25 bp cut | July 24, 2025 | No change | Underweight |
Japan | 3.50% | 0.50% | No change | July 31, 2025 | No change | Underweight |
New Zealand | 2.50% | 3.25% | 25 bp cut | August 20, 2025 | No change | Overweight |
Credit market performance
High yield bonds & leverage loans gained in June benefitting from an improved risk appetite and lower treasury yields amid a dovish Fed rhetoric, receding geopolitical tensions, and positive trade developments. High yield spreads tightened to their lows supported by strong technicals (strong inflows and limited net issuance) and improving capital market conditions. The share of loans priced at par or above (metric to gauge of strong investor demand) increased to 41% by the end of June, fully rebounding from its post ‘Liberation Day’ decline. Loans continue to offer compelling relative value versus high yield bonds. This yield premium reflects two key dynamics: the lower credit quality of the loan market and the persistently elevated SOFR benchmark. However, the credit quality gap between loans and HYBs is narrowing due to a notable improvement in the quality of new loan issuance. As a result, the loan market has seen a shift toward stronger fundamentals.
Index | Yield | Yield m/m | Spread | Spread m/m | Performance (%) | |||
bp | bp | bp | 1m | 3m | YTD | 1Y | ||
Investment Grade | ||||||||
CA | 4.1% | -5 | 102 | -6 | 0.3 | 0.4 | 2.2 | 8.0 |
US | 5.1% | -21 | 86 | -6 | 1.8 | 1.8 | 4.2 | 7.0 |
High Yield | ||||||||
CA | 6.3% | -9 | 308 | -9 | 0.9 | 1.6 | 3.1 | 9.2 |
US | 7.4% | -39 | 296 | -36 | 1.9 | 3.6 | 4.6 | 10.2 |
US Leverage Loans | 8.4% | -13 | 399 | -11 | 0.8 | 2.3 | 2.8 | 7.3 |
Commissions, trailing commissions, management fees, and expenses all may be associated with mutual fund investments. Please read the prospectus before investing. The indicated rates of return are the historical annual compounded total returns as of Jun 30, 2025, including changes in share value and reinvestment of all distributions and does not take into account sales, redemption, distribution, or optional charges or income taxes payable by any security holder that would have reduced returns. Mutual funds are not guaranteed, their values change frequently, and past performance may not be repeated. Index performance does not include the impact of fees, commissions, and expenses that would be payable by investors in the investment products that seek to track an index.
Index performance does not include the impact of fees, commissions, and expenses that would be payable by investors in investment products that seek to track an index.
This document may contain forward-looking information which reflect our or third party current expectations or forecasts of future events. Forward-looking information is inherently subject to, among other things, risks, uncertainties and assumptions that could cause actual results to differ materially from those expressed herein. These risks, uncertainties and assumptions include, without limitation, general economic, political and market factors, interest and foreign exchange rates, the volatility of equity and capital markets, business competition, technological change, changes in government regulations, changes in tax laws, unexpected judicial or regulatory proceedings and catastrophic events. Please consider these and other factors carefully and not place undue reliance on forward-looking information. The forward-looking information contained herein is current only as of Jun 30, 2025. There should be no expectation that such information will in all circumstances be updated, supplemented or revised whether as a result of new information, changing circumstances, future events or otherwise.
The content of this commentary (including facts, views, opinions, recommendations, descriptions of or references to, products or securities) is not to be used or construed as investment advice, as an offer to sell or the solicitation of an offer to buy, or an endorsement, recommendation or sponsorship of any entity or security cited. Although we endeavour to ensure its accuracy and completeness, we assume no responsibility for any reliance upon it.
All information is historical and not indicative of future results. Current performance may be lower or higher than the quoted past performance, which cannot guarantee results. Share price, principal value, and return will vary, and you may have a gain or a loss when you sell your shares. Performance assumes reinvestment of distributions and does not account for taxes. Performance may not reflect any expense limitation or subsidies currently in effect. Short-term trading fees may apply.
This material is for informational and educational purposes only. It is not a recommendation of any specific investment product, strategy, or decision, and is not intended to suggest taking or refraining from any course of action. It is not intended to address the needs, circumstances, and objectives of any specific investor. Mackenzie Investments, which earns fees when clients select its products and services, is not offering impartial advice in a fiduciary capacity in providing this sales and marketing material. This information is not meant as tax or legal advice. Investors should consult a professional advisor before making investment and financial decisions and for more information on tax rules and other laws, which are complex and subject to change.
The rate of return is used only to illustrate the effects of the compound growth rate and is not intended to reflect future values of the mutual fund or returns on investment in the mutual fund.