Monthly commentary - Mackenzie Fixed Income Team

IN THIS ARTICLE min read
Written by the Mackenzie Fixed Income Team
Key Highlights
- The Fed held rates steady in January and shifted toward a more neutral tone as it acknowledged firmer growth and a stabilizing labor market. At the same time, political tensions around Fed independence have intensified, and attention is turning to potential leadership changes with Kevin Warsh viewed as a likely successor to Chair Powell if investigations subside.
- Entering 2026, the U.S. macro backdrop features core PCE near 3% and strong consumption supported by fiscal stimulus, prompting markets to scale back expectations for rate cuts this year.
- The team is monitoring a potential shift in the macro narrative specifically, a transition from a higher‑inflation environment toward one that looks more like a slowing‑growth environment, at least in the U.S. rates market.
- AI‑driven productivity remains a key structural theme as advances in automation could expand supply capacity and help growth run ahead of inflation once tariff effects fade by late spring or summer.
- In Canada, the Bank of Canada also held rates but delivered a more cautious tone as softer growth, moderating inflation, and mixed labor signals raise the likelihood of policy easing in the coming months.
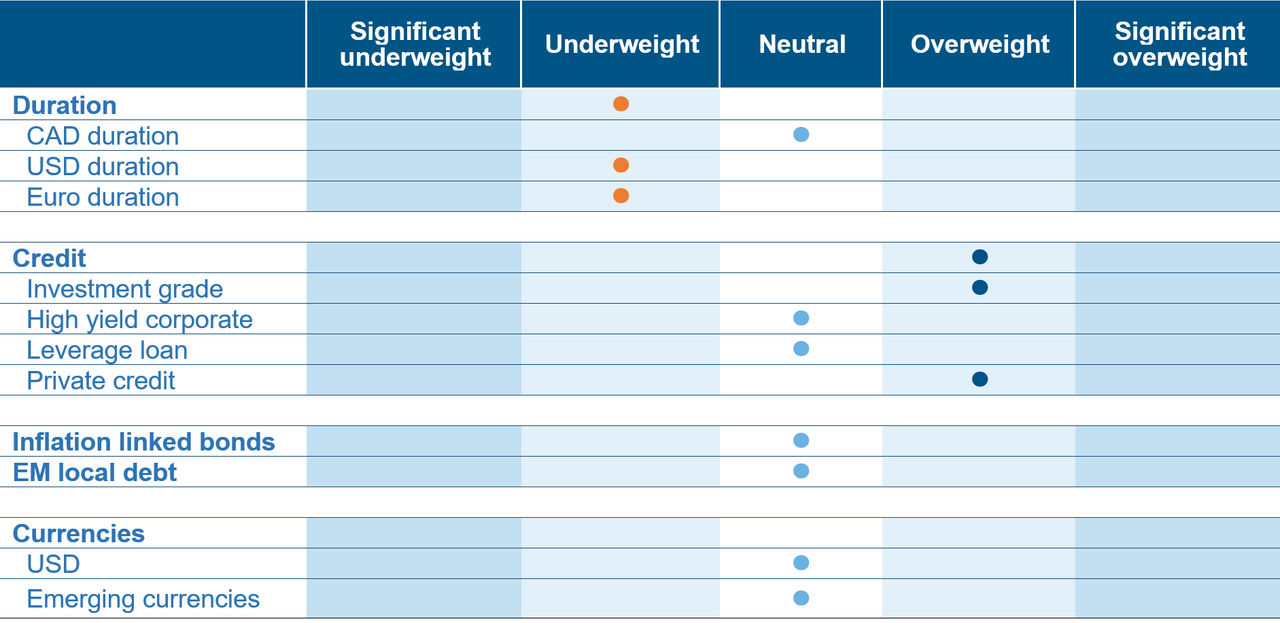
Fixed Income Team Views
 Source: Mackenzie Investments. As of Feb 28, 2026.
Fixed Income Market Update
The Federal Reserve kept the policy rate unchanged at the January meeting as its first meeting without a cut since July 2025 after three reductions in the back half of last year. The Fed upgraded its assessment of the economy, noting more robust growth and a stabilizing labor market, and Chair Powell focused little on additional cuts, signaling a stance closer to neutral for now.
In parallel, Fed independence has been tested by visible White House actions, including investigations into Chair Powell and attempts to remove certain governors. Looking ahead on personnel, if the Department of Justice investigation is put aside, Kevin Warsh is seen as likely to be confirmed as Fed Chair given prior service and broad support.
The U.S. macro mix into early 2026 features core PCE around ~3% y/y for December (pending at the time cited), and strong consumption, helped by fiscal tailwinds from last summer’s One Big Beautiful Bill Act, with tax rebates/credits starting to hit in 1H. Against that backdrop, markets have been pricing out some of the previously expected 2026 Fed cuts over recent months.
A structural theme running through the recent discussions is AI‑driven productivity. Advances in LLMs and agent‑based automation are expected to deliver significant productivity gains, allowing growth and inflation to diverge as supply capacity expands and wage pressure moderates over time. With tariff effects expected to wash through by late spring to summer, focus turns to the evolving inflation trend rather than headline growth prints
Bank of Canada also held rates at its January meeting. In its MPR, it downgraded the 2026 real GDP outlook to ~1.1% and trimmed its inflation outlook to just below 2%. The tone read slightly more dovish, reflecting greater concern about the economic outlook and the evolving CUSMA renegotiation. Despite recent LFS strength, the Bank flagged labor market doubts; the SEPH data released after pointed to ongoing labor softness. Against a backdrop of downgraded growth and slightly lower inflation projections, the Bank of Canada narrative is edging toward greater proactivity if conditions worsen, with attention centered on labor trends, inflation, and the CUSMA renegotiation.
Recent developments around international diplomacy is adding new complications to the USMCA backdrop. Carney, who initially surprised markets with comments appearing supportive of the U.S., has now walked those remarks back during his Asia–Australia tour, reframing the conversation around the evolving geopolitical order. This reversal is not constructive for engagement with the U.S. administration and USTR. What looked less concerning just 24 hours earlier now appears more problematic, especially considering examples like Spain, which illustrate how quickly bilateral dynamics can shift.
Fund Positioning
Cross‑asset volatility has begun to rise from low levels: FX vol has picked up, equity and fixed income vol are moving higher as well. Concurrently, oil has moved higher on heightened Middle East risk, with markets paying closer attention to this episode than to some prior geopolitical events. Through this period, a core stance within fixed income has been to remain short U.S. rates at the long end. The team maintains short positions at the long end of the Treasury curve, a stance driven by persistent sticky inflation, the expectation that the Fed will not cut rates in the near term, and the need for investors to be compensated through a higher term premium to hold long‑duration nominal debt.
In Canada, the team recently added front‑end duration exposure, anchored in the view that the Bank of Canada may need to ease policy rates by April or June. This thesis reflects the Bank’s downgraded GDP and inflation outlook, as well as a noticeable divergence between labor data sets where the SEPH firm‑based survey is flashing weakness, contrasting with the more resilient household survey. With a long pause for policy rates priced into the market at the time of writing, the team sees room for the market to reprice toward cuts.
Across emerging markets, portfolios continue to hold local‑currency bonds in Chile, Mexico, Brazil, and Peru, often leaving the currencies open versus CAD. This reflects the environment in which the U.S. dollar has been under structural pressure, affected by global asset‑manager hedging discussions and, more recently, verbal intervention in USD/JPY that triggered broad USD selling. The weakening dollar and favorable local conditions support maintaining these exposures. A further thematic driver comes from a shift in flow dynamics which show that U.S. investors have increasingly engaged with international assets, that has created a structural “leakage” of the dollar independent of Fed action. In light of the recent geopolitical event the team finds it prudent to tactically hedge its EMFX exposure.
Central Bank Watch
Region | Latest CPI Inflation | Policy rate | Latest policy action | Next decision date | Market expectation | Outlook |
Canada | 2.30% | 2.25% | No change | 18-Mar-26 | No change | Neutral |
United States | 2.40% | 3.75% | No change | 18-Mar-26 | No change | Underweight |
Eurozone | 1.90% | 2.15% | No change | 19-Mar-26 | No change | Underweight |
Japan | 1.50% | 0.75% | No change | 19-Mar-26 | No change | Underweight |
Australia | 3.20% | 3.85% | 25 bp hike | 17-Mar-26 | No change | Overweight |
Credit Market Performance
High‑yield bonds & loans had a tougher tone in February as concerns about AI‑related disruption weighed on risk sentiment, causing spreads to widen and creating noticeable dispersion across both sectors and rating categories. Despite that more cautious backdrop, the high yield asset class still managed to deliver positive performance even though the loan index returned negative performance. As a result, BB rated loans gained 0.2% while B rated loans representing 62% of the index fell by 1.1% and CCC rated loans underperformed by 3.1%. When excluding Software, which accounts for 13% of the outstanding loans tracked by the index, the picture was less severe for the loan market. Top-performing loan borrowers were primarily in non-technology sectors spanning consumer, industrial, and energy.
High yields and spreads moved higher over the month, while BB rated bond yields held steady, B rated yields climbed by 27 bps and CCC rated higher by 55 bps. One of the most notable areas of pressure was software, where high‑yield bonds saw spreads widen by 104 bps in February and now sit 175 bps wider ytd, underscoring how intensely AI concerns have affected that segment of the market. Higher‑quality BBs led the way with a gain of +0.59%, while single‑B names slipped -0.1% and CCCs fell -0.6%. Sector performance also varied widely with Energy was February’s standout at +1.08%, while Technology lagged at -1.06%, reflecting pressure on software issuers.
Index | Yield | Yield m/m | Spread | Spread m/m | Performance (%) | |||
bp | bp | bp | 1m | 3m | YTD | 1Y | ||
Investment Grade | ||||||||
CA | 3.8% | -13 | 91 | 8 | 1.3 | 1.4 | 2.1 | 4.5 |
US | 4.8% | -11 | 86 | 11 | 1.2 | 1.3 | 1.6 | 6.7 |
High Yield |
|
|
|
|
|
|
|
|
CA | 6.7% | 6 | 268 | 19 | 0.2 | 1.0 | 0.6 | 5.2 |
US | 7.2% | 10 | 312 | 24 | 0.1 | 1.3 | 0.6 | 7.0 |
US Leverage Loans | 8.3% | 30 | 446 | 29 | 0.8 | -0.5 | -1.1 | 3.9 |
Commissions, trailing commissions, management fees, and expenses all may be associated with mutual fund investments. Please read the prospectus before investing. The indicated rates of return are the historical annual compounded total returns as of Feb 28, 2026, including changes in share value and reinvestment of all distributions and does not take into account sales, redemption, distribution, or optional charges or income taxes payable by any security holder that would have reduced returns. Mutual funds are not guaranteed, their values change frequently, and past performance may not be repeated. Index performance does not include the impact of fees, commissions, and expenses that would be payable by investors in the investment products that seek to track an index.
Index performance does not include the impact of fees, commissions, and expenses that would be payable by investors in investment products that seek to track an index.
This document may contain forward-looking information which reflect our or third party current expectations or forecasts of future events. Forward-looking information is inherently subject to, among other things, risks, uncertainties and assumptions that could cause actual results to differ materially from those expressed herein. These risks, uncertainties and assumptions include, without limitation, general economic, political and market factors, interest and foreign exchange rates, the volatility of equity and capital markets, business competition, technological change, changes in government regulations, changes in tax laws, unexpected judicial or regulatory proceedings and catastrophic events. Please consider these and other factors carefully and not place undue reliance on forward-looking information. The forward-looking information contained herein is current only as of Feb 28, 2026. There should be no expectation that such information will in all circumstances be updated, supplemented or revised whether as a result of new information, changing circumstances, future events or otherwise.
The content of this commentary (including facts, views, opinions, recommendations, descriptions of or references to, products or securities) is not to be used or construed as investment advice, as an offer to sell or the solicitation of an offer to buy, or an endorsement, recommendation or sponsorship of any entity or security cited. Although we endeavour to ensure its accuracy and completeness, we assume no responsibility for any reliance upon it.
All information is historical and not indicative of future results. Current performance may be lower or higher than the quoted past performance, which cannot guarantee results. Share price, principal value, and return will vary, and you may have a gain or a loss when you sell your shares. Performance assumes reinvestment of distributions and does not account for taxes. Performance may not reflect any expense limitation or subsidies currently in effect. Short-term trading fees may apply.
This material is for informational and educational purposes only. It is not a recommendation of any specific investment product, strategy, or decision, and is not intended to suggest taking or refraining from any course of action. It is not intended to address the needs, circumstances, and objectives of any specific investor. Mackenzie Investments, which earns fees when clients select its products and services, is not offering impartial advice in a fiduciary capacity in providing this sales and marketing material. This information is not meant as tax or legal advice. Investors should consult a professional advisor before making investment and financial decisions and for more information on tax rules and other laws, which are complex and subject to change.
The rate of return is used only to illustrate the effects of the compound growth rate and is not intended to reflect future values of the mutual fund or returns on investment in the mutual fund.