
Written by the Mackenzie Fixed Income Team
Key Highlights
- Despite dovish language on labor markets, Chair Powell’s strong pushback against a December rate cut introduced uncertainty, especially amid missing economic data due to the U.S. government shutdown.
- While the Fed’s 25bps rate cut was expected, the decision to end Quantitative Tightening on December 1st marked a significant policy shift, easing liquidity conditions and signaling a more dovish stance.
- The Bank of Canada cut rates to the lower bound of its neutral range but hinted at a pause, focusing more on slowing growth than inflation, which has moderated despite higher oil prices.
- Global funds reduced U.S. duration and spread trades, favoring Canadian 2–5 year bonds on expectations of further BoC easing. A tactical long USD/CAD position reflects a cautious view of Canada’s economic outlook.
- Emerging market positions remain currency-hedged and selective. South Africa and Peru stand out with low inflation and high real yields, though the Fed’s hawkish tone warrants caution in lower-yielding EMs.
Fixed Income Team Views
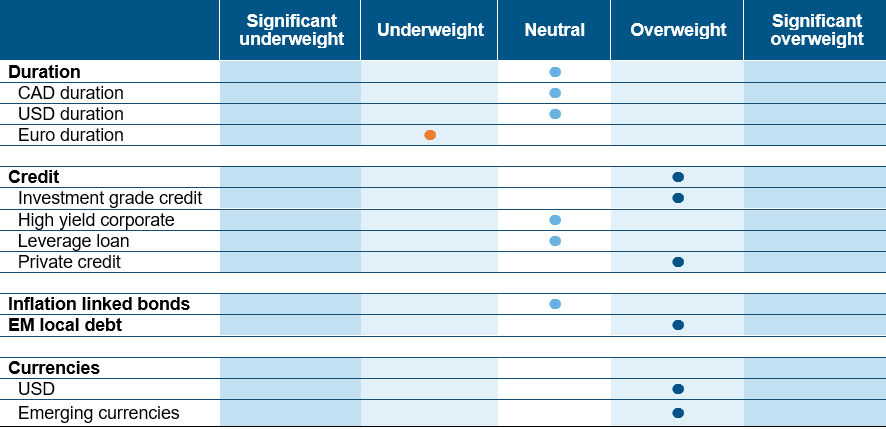 Source: Mackenzie Investments. As of Oct 31, 2025.
Fixed Income Market Update
The Federal Reserve delivered a widely expected 25 basis point rate cut, fully priced in by markets ahead of the announcement. However, the real surprise came from the Fed’s decision to end its Quantitative Tightening program starting December 1st. This move signals a shift in policy stance, reducing the contradictory effect of easing rates while simultaneously withdrawing liquidity.
The Fed’s statement included a dovish note on labor market risks, but this was tempered by Chair Powell’s press conference, where he strongly pushed back against expectations of a December rate cut. This deviation from the usual “no pre-commitment” stance added uncertainty to the policy path, especially considering missing top-tier data due to the ongoing U.S. government shutdown.
The market responded swiftly as pricing for December rate cuts dropped and expectations for 2026 rate cuts fell lower by one rate cut, reflecting a significant repricing of the U.S. Treasury curve and a bid for the U.S. dollar.
The Bank of Canada also cut rates by 25 basis points, bringing the overnight rate to 2.25%, the lower bound of its estimated neutral range (2.25%–3.25%). While the cut was expected, the Bank’s language suggested a pause in the easing cycle, contingent on the economy evolving as anticipated.
However, the Bank’s downward revisions to real GDP growth forecasts, a 0.6% cut for 2025 and a 0.7% cut for 2026, signal growing concerns about the economic outlook. The Bank of Canada’s inflation concerns have eased. Core inflation risks have diminished following the removal of reciprocal tariffs, and headline inflation remains contained despite rising oil prices. The Bank appears more focused on economic growth risks than inflation, suggesting that slowing aggregate demand could further dampen inflationary pressures.
Covering the recent Canadian Fiscal Budget, while many of the major spending items were already anticipated, the budget’s structure, particularly the separation of operational and capital expenditures, was a constructive step. Operational spending is targeted to balance over the next three years, while capital investments are expected to support long-term economic growth. From a bond market standpoint, concerns about a potential spike in long-end yields were largely unfounded. The government’s issuance strategy, which leaned toward shorter maturities and kept long-end issuance modest, was well-received. Canadian long bonds even outperformed U.S. counterparts in the immediate aftermath. The real challenge now lies in execution. Budget announcements don’t always translate into actual spending, and revenue projections can shift. The government’s ability to deliver on its commitments will be critical in determining the budget’s true economic impact. We view the budget as a recalibration rather than a transformation. A step in the right direction, but not a game-changer on its own.
Fund Positioning
We interpret this as a potential precursor to further easing, possibly one or two more cuts in the first half of 2026, especially if immigration slows, housing resets intensify, and trade uncertainty persists. The portfolio positioning reflects a cautious stance toward U.S. rates, with a noticeable reduction in exposure to U.S.–Canada and U.S.–Germany spread trades. This shift signals a growing expectation of rising interest rates in the U.S., likely driven by the Federal Reserve’s increasingly hawkish tone. Conversely, there’s a constructive outlook on Canadian front-end rates, particularly in the 2–5 year segment, underpinned by expectations of further monetary easing from the Bank of Canada. This has led to a strategic tilt toward long positions in that part of the curve.
On the currency front, a tactical long USD/CAD position has been initiated, anticipating potential weakness in the Canadian dollar should domestic economic conditions deteriorate. This reflects a broader macro view that sees relative strength in the U.S. economy compared to Canada.
Emerging market exposure remains selective, with notable outperformance in countries like Brazil, Mexico, Peru and South Africa. The South Africa and Peru positions are currency-hedged to mitigate foreign exchange risk. The South African curve, while having performed admirably, remains steep and stands out as a credible momentum and carry play. Peru presents an attractive opportunity for bond investors, with inflation well contained below the central bank’s 2% target, yet interest rates remain relatively high. This means Peru offers one of the highest real yields among emerging markets. With the U.S. Fed expected to cut rates, Peru’s central bank has both the flexibility and incentive to follow suit. However, the Fed’s hawkish pivot introduces a layer of uncertainty, prompting a reassessment of holdings, particularly in lower-yielding EMs that may be more vulnerable in a rising rate environment.
Central Bank Watch
Region | Latest CPI Inflation | Policy rate | Latest policy action | Next decision date | Market expectation | Outlook |
Canada | 2.40% | 2.25% | 25 bp cut | 10-Dec-25 | No change | Neutral |
United States | 3.00% | 4.25% | 25 bp cut | 10-Dec-25 | Rate cut | Neutral |
Eurozone | 2.20% | 2.15% | No change | 18-Dec-25 | No change | Neutral |
Japan | 2.90% | 0.50% | No change | 19-Dec-25 | No change | Underweight |
New Zealand | 3.00% | 2.50% | 50 bp cut | 25-Nov-25 | Rate cut | Neutral |
Credit Market Performance
High-yield bond spreads widened modestly in October, reflecting a month of contrasting market dynamics. The first half was marked by investor caution as concerns over rising credit risks, renewed trade tensions, signs of economic deceleration, and the threat of a U.S. government shutdown weighed on sentiment, pushing spreads wider. However, a strong start to third-quarter earnings, a Federal Reserve delivering rate cut, easing trade tensions, and signs of stabilization in the unemployment rate helped restore confidence. Performance across credit ratings showed clear signs of decompression. CCC-rated bonds posted their first monthly loss in six months, declining 0.06%, while BB-rated bonds outperformed with a 0.60% gain. Single B-rated bonds were nearly flat, up just 0.06% for the month. Sector performance was equally varied. Telecom led the way with a 1.39% monthly gain, while Paper and Packaging lagged significantly, falling 2.05%.
The U.S. leveraged loan market softened in October, weighed down by a combination of retail outflows, sector-specific challenges, and weakness in AI-linked names. Softer demand met with increased supply, while headwinds in certain industries and idiosyncratic issues among select issuers added pressure to secondary loan prices. B rated loans returned 0.28%, trailing the smaller BB cohort, which gained 0.32%. At the riskiest end of the spectrum, CCC rated loans declined by 20 bps, reflecting weaker secondary pricing and heightened risk aversion. The Chemicals sector stood out for its underperformance, with loans falling 1.4% a broader global downturn in the industry. Despite retail investor pullback, demand strengthened, supported by a surge in CLO issuance, which helped offset some of the weakness.
Index | Yield | Yield m/m | Spread | Spread m/m | Performance (%) | |||
bp | bp | bp | 1m | 3m | YTD | 1Y | ||
Investment Grade | ||||||||
CA | 3.85% | -5 | 93 | 1 | 0.7 | 2.4 | 4.7 | 6.3 |
US | 4.87% | 0 | 80 | 4 | 0.4 | 3 | 7.4 | 6.8 |
High Yield |
|
|
|
|
|
|
|
|
CA | 5.90% | -3 | 280 | 3 | 0.6 | 2.5 | 6.4 | 7.8 |
US | 7.17% | 11 | 294 | 14 | 0.2 | 2.2 | 7.3 | 8.0 |
US Leverage Loans | 8.10% | -9 | 394 | 6 | 0.2 | 1.1 | 4.9 | 6.3 |
Commissions, trailing commissions, management fees, and expenses all may be associated with mutual fund investments. Please read the prospectus before investing. The indicated rates of return are the historical annual compounded total returns as of October 31, 2025, including changes in share value and reinvestment of all distributions and does not take into account sales, redemption, distribution, or optional charges or income taxes payable by any security holder that would have reduced returns. Mutual funds are not guaranteed, their values change frequently, and past performance may not be repeated. Index performance does not include the impact of fees, commissions, and expenses that would be payable by investors in the investment products that seek to track an index.
Index performance does not include the impact of fees, commissions, and expenses that would be payable by investors in investment products that seek to track an index.
This document may contain forward-looking information which reflect our or third party current expectations or forecasts of future events. Forward-looking information is inherently subject to, among other things, risks, uncertainties and assumptions that could cause actual results to differ materially from those expressed herein. These risks, uncertainties and assumptions include, without limitation, general economic, political and market factors, interest and foreign exchange rates, the volatility of equity and capital markets, business competition, technological change, changes in government regulations, changes in tax laws, unexpected judicial or regulatory proceedings and catastrophic events. Please consider these and other factors carefully and not place undue reliance on forward-looking information. The forward-looking information contained herein is current only as of Oct 31, 2025. There should be no expectation that such information will in all circumstances be updated, supplemented or revised whether as a result of new information, changing circumstances, future events or otherwise.
The content of this commentary (including facts, views, opinions, recommendations, descriptions of or references to, products or securities) is not to be used or construed as investment advice, as an offer to sell or the solicitation of an offer to buy, or an endorsement, recommendation or sponsorship of any entity or security cited. Although we endeavour to ensure its accuracy and completeness, we assume no responsibility for any reliance upon it.
All information is historical and not indicative of future results. Current performance may be lower or higher than the quoted past performance, which cannot guarantee results. Share price, principal value, and return will vary, and you may have a gain or a loss when you sell your shares. Performance assumes reinvestment of distributions and does not account for taxes. Performance may not reflect any expense limitation or subsidies currently in effect. Short-term trading fees may apply.
This material is for informational and educational purposes only. It is not a recommendation of any specific investment product, strategy, or decision, and is not intended to suggest taking or refraining from any course of action. It is not intended to address the needs, circumstances, and objectives of any specific investor. Mackenzie Investments, which earns fees when clients select its products and services, is not offering impartial advice in a fiduciary capacity in providing this sales and marketing material. This information is not meant as tax or legal advice. Investors should consult a professional advisor before making investment and financial decisions and for more information on tax rules and other laws, which are complex and subject to change.
The rate of return is used only to illustrate the effects of the compound growth rate and is not intended to reflect future values of the mutual fund or returns on investment in the mutual fund.