
Written by the Mackenzie Fixed Income Team
Key Highlights
- The market has begun to reassess the pace and magnitude of Fed rate cuts into 2026, with 25 bp already priced out. This repricing supports our tactical long USD positioning, particularly against CAD, even as our structural view remains bearish on the dollar versus EUR and AUD.
- We have moderated our U.S. duration exposure from significant overweight to overweight, reflecting increased uncertainty around curve dynamics where concerns around Fed independence and sticky inflation persist.
- In Canada, we continue to see potential for curve steepening, supported by fiscal clarity. However, any unexpected issuance strategy or structural shifts could prompt a reassessment of long-end positioning.
- We exited tactical spread trades in France vs. Germany and U.S. vs. Canada, having captured the expected widening and narrowing respectively as valuations reached target levels.
- Within our global funds, we maintain a constructive view on emerging markets, with local exposure diversified across Brazil, Mexico, South Africa, and Peru, reflecting a balanced approach.
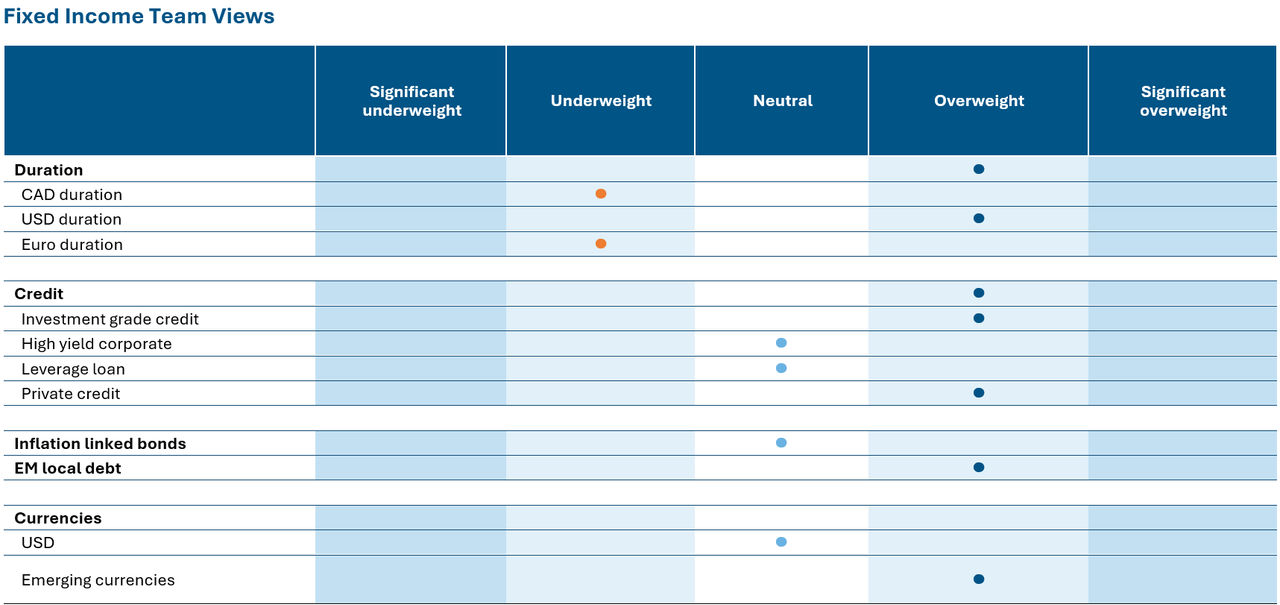 Source: Mackenzie Investments. As of Sep 30, 2025.
Fixed Income Market Update
As we enter Q4 2025, the macro landscape continues to evolve in ways that challenge consensus positioning. One of the most important themes we are watching is the repricing of Fed rate expectations, particularly into 2026. Prior to the rate cut, the market had previously priced in up to 150 basis points of cuts through the end of 2026. However, with recent developments, we have already seen about 50 bps priced out and believe there is more to come. This repricing has direct implications for U.S. treasury curve, especially at the front end of the curve, where yields may need to adjust higher. We remain tactically long USD, supported by the view that the Fed will remain more cautious than the market expects, and that real interest rates may stay elevated due to stronger than expected productivity growth.
While the administration may eventually shape the Fed to its preferences, concerns around Fed independence and sticky inflation could lead to bond market volatility, particularly at the long end. We see a potential camp of investors growing wary of holding long-duration nominal U.S. bonds, especially if inflation remains persistent and political influence over monetary policy intensifies. That said, we believe the administration is unlikely to tolerate a disorderly rise in yields and may deploy non-traditional tools to contain any back-end selloff.
From a Canadian perspective, uncertainty around trade relations, particularly under USMCA renewal could weigh on growth. While Canada has not yet felt the full impact of U.S. tariff policy, the risk remains. The Canadian dollar may underperform other G10 currencies, even if the U.S. dollar weakens more broadly.
Fund Positioning
We currently see potential for a steepening bias in the Canadian yield curve, while maintaining a mild flattening view in the U.S. However, recent developments particularly the U.S. Office of Management signaling layoffs rather than furloughs have introduced uncertainty into the U.S. curve outlook. This has led us to moderate our US duration positioning from significant overweight to overweight.
On the Canadian fiscal front, the market appears adjusting to a deficit range in the $68–$80 billion neighbourhood. While the absolute numbers are large, a spend-heavy budget alone may not be sufficient to drive a sell-off in long-dated Canadian bonds, unless it comes with unexpected structural implications or a notable shift in issuance strategy & could prompt a reassessment of market positioning, particularly at the long end of the curve.
While our structural view remains bearish on the U.S. dollar, particularly against the euro and Australian dollar, we have tactically shifted to a short-term long USD position versus CAD rationalizing the move to neutral from overweight. This adjustment reflects recent market dynamics, notably the repricing of expected Fed rate cuts which has supported the dollar over the past few weeks. We recognize this tactical stance runs counter to our longer term thesis, but short-term dislocations can warrant temporary divergence.
Within our global funds, we closed our U.S. – Canada spread trade as the trade had reached levels, we deemed attractive, and with diminishing conviction in further narrowing, we exited the position. We tactically exited our France vs. Germany government bond spread early this month. The position was initiated on expectations of political volatility in France, which materialized as anticipated & the spread widened accordingly, allowing us to monetize the trade. On the emerging market front, we maintain a balanced exposure across both currency and duration. Our local currency allocation stands in Brazil, Mexico, South Africa, and Peru reflecting a constructive view on long-end valuations and curve steepening potential in select EM markets.
Central Bank Watch
Region | Latest CPI Inflation | Policy rate | Latest policy action | Next decision date | Market expectation | Outlook |
Canada | 1.90% | 2.50% | 25 bp cut | 29-Oct-25 | Rate cut | Underweight |
United States | 2.90% | 4.25% | No change | 29-Oct-25 | Rate cut | Overweight |
Eurozone | 2.00% | 2.15% | No change | 30-Oct-25 | No change | Neutral |
Japan | 2.70% | 0.50% | No change | 30-Oct-25 | No change | Underweight |
New Zealand | 2.70% | 2.50% | 50 bp cut | 26-Nov-25 | Rate cut | Neutral |
Credit market performance
High-yield bond yields and spreads declined in September, which are 68bp and 6bp lower ytd respectively amid resilient consumer spending and an insurance cut from the Fed. High-yield bonds provided monthly gain of +0.8% gain in September, with Single Bs (+0.81%) outperforming BBs (+0.72%) and CCCs (+0.52%). Outperforming in September was Media (+3.17%) and Retail (+3.09%) with Chemicals (-0.06%) and Services (+0.07%) lagging.
The loan index posted a modest gain of 0.4% in September was dampened by the default of a large automotive aftermarket supplier, excluding this event, the index would have returned 0.6%. What stood out was the speed and severity of the collapse as loan prices for the issuer plunged from the mid-90s to the mid-30s within weeks, delivering an outsized drag on overall performance. Performance across rating segments was mixed with B rated loans (62% of the index) returned 0.35%, underperforming BB rated loans (24% of the index) gained 0.49%. At the riskiest end, CCC-rated loans returned 0.97%, leading the pack. Recovery rates in the loan market hit record lows during the period, as issuers increasingly turned to liability management exercises to restructure distressed debt.
Index | Yield | Yield m/m | Spread | Spread m/m | Performance (%) | |||
bp | bp | bp | 1m | 3m | YTD | 1Y | ||
Investment Grade | ||||||||
CA | 3.90% | -21 | 92 | -2 | 1.6 | 1.8 | 4 | 5.2 |
US | 4.87% | -10 | 76 | -4 | 1.4 | 2.6 | 7 | 3.9 |
High Yield |
|
|
|
|
|
|
|
|
CA | 5.93% | -14 | 277 | 1 | 0.9 | 2.6 | 5.8 | 7.9 |
US | 7.06% | -7 | 280 | -4 | 0.8 | 2.4 | 7.1 | 7.2 |
US Leverage Loans | 8.25% | -9 | 393 | 3 | 0.4 | 1.8 | 4.6 | 7.0 |
Commissions, trailing commissions, management fees, and expenses all may be associated with mutual fund investments. Please read the prospectus before investing. The indicated rates of return are the historical annual compounded total returns as of Sep 30, 2025, including changes in share value and reinvestment of all distributions and does not take into account sales, redemption, distribution, or optional charges or income taxes payable by any security holder that would have reduced returns. Mutual funds are not guaranteed, their values change frequently, and past performance may not be repeated. Index performance does not include the impact of fees, commissions, and expenses that would be payable by investors in the investment products that seek to track an index.
Index performance does not include the impact of fees, commissions, and expenses that would be payable by investors in investment products that seek to track an index.
This document may contain forward-looking information which reflect our or third party current expectations or forecasts of future events. Forward-looking information is inherently subject to, among other things, risks, uncertainties and assumptions that could cause actual results to differ materially from those expressed herein. These risks, uncertainties and assumptions include, without limitation, general economic, political and market factors, interest and foreign exchange rates, the volatility of equity and capital markets, business competition, technological change, changes in government regulations, changes in tax laws, unexpected judicial or regulatory proceedings and catastrophic events. Please consider these and other factors carefully and not place undue reliance on forward-looking information. The forward-looking information contained herein is current only as of Sep 30, 2025. There should be no expectation that such information will in all circumstances be updated, supplemented or revised whether as a result of new information, changing circumstances, future events or otherwise.
The content of this commentary (including facts, views, opinions, recommendations, descriptions of or references to, products or securities) is not to be used or construed as investment advice, as an offer to sell or the solicitation of an offer to buy, or an endorsement, recommendation or sponsorship of any entity or security cited. Although we endeavour to ensure its accuracy and completeness, we assume no responsibility for any reliance upon it.
All information is historical and not indicative of future results. Current performance may be lower or higher than the quoted past performance, which cannot guarantee results. Share price, principal value, and return will vary, and you may have a gain or a loss when you sell your shares. Performance assumes reinvestment of distributions and does not account for taxes. Performance may not reflect any expense limitation or subsidies currently in effect. Short-term trading fees may apply.
This material is for informational and educational purposes only. It is not a recommendation of any specific investment product, strategy, or decision, and is not intended to suggest taking or refraining from any course of action. It is not intended to address the needs, circumstances, and objectives of any specific investor. Mackenzie Investments, which earns fees when clients select its products and services, is not offering impartial advice in a fiduciary capacity in providing this sales and marketing material. This information is not meant as tax or legal advice. Investors should consult a professional advisor before making investment and financial decisions and for more information on tax rules and other laws, which are complex and subject to change.
The rate of return is used only to illustrate the effects of the compound growth rate and is not intended to reflect future values of the mutual fund or returns on investment in the mutual fund.