

Monthly commentary - Mackenzie Fixed Income Team


About the author
IN THIS ARTICLE
Highlights
- Resilient US growth, heavy corporate issuance, including financing for AI investment, and renewed energy-price pressures contributed to rising bond yields in Canada, the United States and other major markets.
- The Federal Reserve raised rates and signalled further tightening, while the Bank of Canada held steady but shifted its focus towards upside inflation risks. The team remains cautious about the sustainability of Canadian growth.
- The macro team reduced Canadian and US duration exposure, seeking greater confirmation before adding interest-rate risk given elevated volatility and the limited additional yield available from longer-maturity bonds.
- Credit allocations were largely unchanged, with Canadian-dollar hybrids still favoured and higher-quality credit additions under consideration. The team also added currency-hedged Mexican government bonds for their additional yield after hedging.
- Coupon income and investor inflows supported loans, while CCC-rated credits continued to struggle. Increased term-loan allocations contributed to relative fund performance, and CCC underweights helped limit exposure to some of September’s largest decliners.
Fixed Income Team views
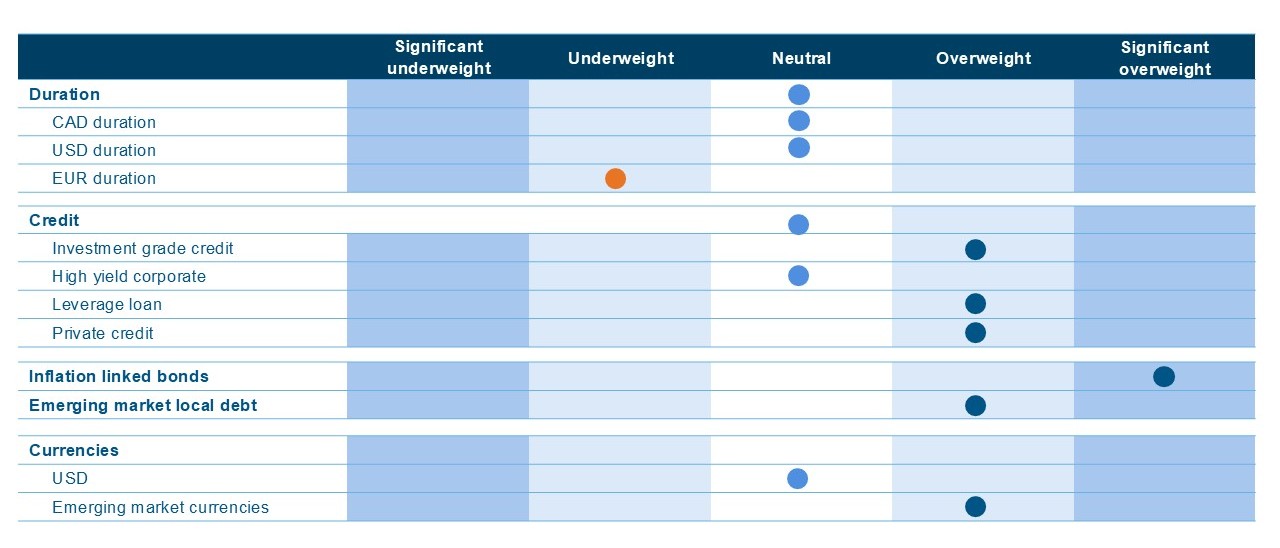 Source: Mackenzie Investments. As of September 30, 2026
Fixed Income market update
September was a challenging month for fixed income, with bond yields moving higher in Canada, the United States and other major markets. The fixed income team identified several overlapping drivers in the form of resilient US growth, substantial corporate issuance, renewed pressure on energy prices and a reassessment of central-bank policy. Artificial intelligence-related capital spending continued to support US economic activity, while the associated financing requirements added to bond supply, particularly at longer maturities.
Renewed Middle East hostilities added to pressure across the energy complex. Higher oil, diesel and natural gas prices were feeding into transportation and other costs, reinforcing concerns that inflation could remain elevated. In the team’s assessment, these pressures, together with heavy issuance, left longer-term bonds vulnerable even with further monetary tightening. US Treasury buyback operations had not prevented yields from moving higher, underscoring the continued influence of these underlying market drivers.
The Federal Reserve raised its policy rate by 25 basis points, its first increase in approximately three years. Its updated projections pointed to further tightening before year-end and no rate cuts in 2027, a change from June’s expectation of easing next year. Immediately following the announcement, shorter-term yields rose while longer-term yields declined, flattening the yield curve. The team viewed this initial response as consistent with greater confidence in the Fed’s commitment to addressing inflation, rather than a resolution of the broader pressures facing bonds.
In Canada, the Bank of Canada held its policy rate at 2.25%, as expected. The team noted a shift in the Bank’s communication towards upside inflation risks and away from its earlier emphasis on tariff-related growth weakness. The Bank highlighted the second-quarter growth rebound, but the team questioned whether that momentum would persist given population and immigration trends. Although the domestic policy outlook remained important, Canadian bond yields continued to take direction from developments in the larger US market.
Looking ahead, the approaching US midterm elections introduced another policy risk around AI investment incentives. We do not expect those incentives to be unwound but view a reversal as potentially significant for capital spending, valuations and bond markets. This remained a risk to monitor rather than the central expectation, given the importance of AI investment to the team’s assessment of US economic strength.
Fund positioning
The macro team was broadly neutral on Canadian and US duration coming into the FOMC versus overweight at the start of the month. The previous Canadian duration overweight had been sold, while the interest-rate exposure of the US Treasury Inflation-Protected Securities position had been offset with short Treasury futures. The remaining inflation-protection trade was being unwound. The team seeks more confirmation before adding duration again, noting the limited additional yield available from longer maturities relative to shorter bonds and the risks associated with elevated volatility.
In emerging markets, currency exposure on the Mexican and Brazilian bond holdings had been hedged, while the underlying bonds were retained. The Brazilian hedge was introduced ahead of the election. The team had also been adding currency-hedged Mexican government bonds, citing the additional yield available after hedging. The call also noted a recent addition of Australian rates exposure. Credit allocations were largely unchanged with participation in new issues, alongside sales of shorter-dated bonds, modestly increased spread-risk exposure. Team continues to favour Canadian-dollar hybrids and looking to add higher-quality credit and higher-quality high-yield exposure in an environment in which earning carry remained important, with limited movement in spreads.
The credit and high yield bond funds increased term-loan allocations, which positively contributed to relative performance in September. Their underweight in CCC-rated bonds also helped limit exposure to some of the month’s largest decliners.
On monetary policy, we expect one or two further Fed rate increases. We also see scope for Bank of Canada hikes, potentially beginning in December, while cautioning that underlying Canadian growth was weaker than the Bank’s assessment and that tightening could prove to be a policy error.
Credit market performance
September brought a sharp divergence between US fixed-rate high-yield bonds and floating-rate leveraged loans. Escalating Middle East tensions and a more hawkish Federal Reserve pushed Treasury yields higher, while heavy issuance and fund outflows added pressure on high-yield bonds. Technology and healthcare bonds held up better than the broader market, while telecommunications and cable lagged. Leveraged loans were more resilient, supported by coupon income, positive investor flows and a recovery in software-related credits. The Fed’s rate increase also improved the outlook for future floating-rate interest income. However, loan prices retreated late in the month as stronger business activity and inflation concerns weighed on sentiment.
Credit quality remained a dividing line: single-B credits outperformed in both markets, while CCC-rated borrowers continued to struggle. Lower-rated loan issuers faced more limited refinancing options and rising debt-service costs. Primary markets nevertheless remained active, with acquisition and buyout financing rebounding and large transactions contributing to a busy issuance calendar. High-yield net issuance reached a record despite the weaker secondary market. Meanwhile, default and distressed-exchange activity moderated during the third quarter. J.P. Morgan reported two payment defaults and no distressed exchanges in September, although payment-default volume for the year remained above the comparable period in 2025.
Index | Yield | Yield m/m | Spread | Spread m/m | Performance (%) | |||
bp | bp | bp | 1m | 3m | YTD | 1Y | ||
Investment Grade | ||||||||
CA | 4.6% | 24 | 87 | -4 | -0.8 | -2.2 | 0.0 | 0.3 |
US | 6.1% | 54 | 84 | 4 | -2.7 | -3.8 | -2.8 | -2.0 |
High Yield |
|
|
|
|
|
|
|
|
CA | 7.9% | 71 | 285 | 32 | -1.7 | -1.4 | 0.3 | 1.7 |
US | 8.5% | 88 | 312 | 49 | -2.5 | -1.8 | 0.0 | 1.4 |
US Leverage Loans | 8.3% | 21 | 427 | 8 | 1.2 | 1.2 | 1.6 | 4.7 |
Source: Bloomberg as of 30th September 2026, performance is reflective of local returns
Commissions, trailing commissions, management fees, and expenses all may be associated with mutual fund investments. Please read the prospectus before investing. The indicated rates of return are the historical annual compounded total returns as of September 30, 2026, including changes in share value and reinvestment of all distributions and does not take into account sales, redemption, distribution, or optional charges or income taxes payable by any security holder that would have reduced returns. Mutual funds are not guaranteed, their values change frequently, and past performance may not be repeated. Index performance does not include the impact of fees, commissions, and expenses that would be payable by investors in the investment products that seek to track an index.
This document may contain forward-looking information which reflect our or third party current expectations or forecasts of future events. Forward-looking information is inherently subject to, among other things, risks, uncertainties, and assumptions that could cause actual results to differ materially from those expressed herein. These risks, uncertainties and assumptions include, without limitation, general economic, political and market factors, interest and foreign exchange rates, the volatility of equity and capital markets, business competition, technological change, changes in government regulations, changes in tax laws, unexpected judicial or regulatory proceedings and catastrophic events. Please consider these and other factors carefully and not place undue reliance on forward-looking information. The forward-looking information contained herein is current only as of September 30, 2026. There should be no expectation that such information will in all circumstances be updated, supplemented or revised whether as a result of new information, changing circumstances, future events or otherwise.
The content of this commentary (including facts, views, opinions, recommendations, descriptions of or references to, products or securities) is not to be used or construed as investment advice, as an offer to sell or the solicitation of an offer to buy, or an endorsement, recommendation or sponsorship of any entity or security cited. Although we endeavour to ensure its accuracy and completeness, we assume no responsibility for any reliance upon it.
All information is historical and not indicative of future results. Current performance may be lower or higher than the quoted past performance, which cannot guarantee results. Share price, principal value, and return will vary, and you may have a gain or a loss when you sell your shares. Performance assumes reinvestment of distributions and does not account for taxes. Performance may not reflect any expense limitation or subsidies currently in effect. Short-term trading fees may apply.
This material is for informational and educational purposes only. It is not a recommendation of any specific investment product, strategy, or decision, and is not intended to suggest taking or refraining from any course of action. It is not intended to address the needs, circumstances, and objectives of any specific investor. Mackenzie Investments, which earns fees when clients select its products and services, is not offering impartial advice in a fiduciary capacity in providing this sales and marketing material. This information is not meant as tax or legal advice. Investors should consult a professional advisor before making investment and financial decisions and for more information on tax rules and other laws, which are complex and subject to change.
The rate of return is used only to illustrate the effects of the compound growth rate and is not intended to reflect future values of the mutual fund or returns on investment in the mutual fund.