.svg)
.svg)
Monthly commentary - Mackenzie Fixed Income Team


About the author
IN THIS ARTICLE
Highlights
- AI-driven infrastructure spending continues supporting U.S. growth, inflation pressures, and corporate borrowing needs.
- Rising bond yields reflect supply-demand dynamics and valuations, not market stress or dysfunction.
- Higher real and nominal yields have improved duration attractiveness, especially in U.S. markets.
- Portfolios remain overweight U.S. duration, primarily through inflation-linked bonds with attractive real yields.
- Credit markets strengthened, but compressed spreads keep security selection more important than broad risk-taking.
Fixed Income Team views
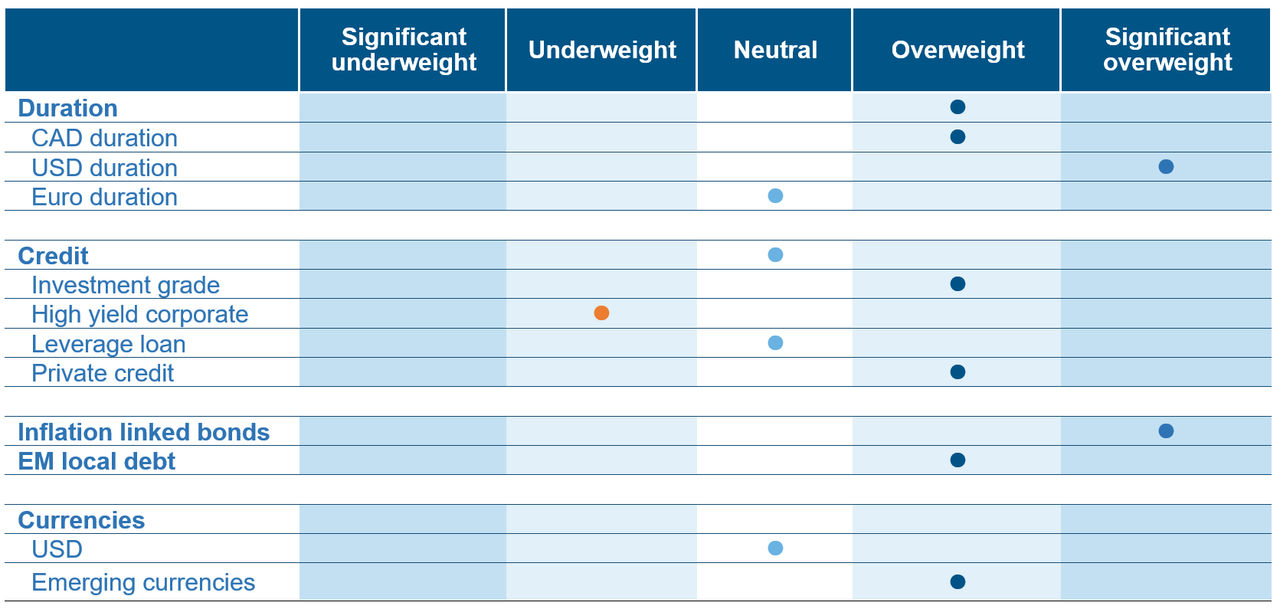 Source: Mackenzie Investments. As of Aug 31, 2026
Fixed Income market update
Fixed income markets continue to be influenced by more than the near-term path of central-bank policy. Artificial-intelligence-related capital spending remains an important source of U.S. economic activity, with significant investment in data centres, power infrastructure and computing capacity. While the absolute level of investment remains elevated, the pace of growth may be approaching a peak as the build-out matures. For now, the investment cycle remains more visible as a source of demand than as a productivity benefit, as infrastructure must first be financed and constructed before efficiency gains can be realized. This has supported economic growth, while also adding to inflation pressures and corporate financing requirements. Hyperscalers have issued significant debt across the curve, including at longer maturities, creating an additional source of duration supply alongside U.S. Treasury issuance.
The Federal Reserve raised rates in September, reinforcing the continued importance of inflation in the policy outlook. However, monetary policy is only one factor influencing global bond markets. Corporate bond issuance, energy prices and persistent inflation concerns have also contributed to higher yields. The team does not view the recent increase in bond yields as evidence of disorderly market conditions. The move has occurred without a corresponding increase in volatility or a broader deterioration in fixed income market functioning. In the team’s assessment, the rise in yields increasingly reflects changing valuations and supply-and-demand dynamics rather than market panic.
This distinction is important for portfolio positioning. As nominal and real yields have moved higher, the compensation available for taking duration risk has improved. At current levels, particularly in the U.S., the team believes valuations have become sufficiently attractive to add duration rather than remain broadly defensive.
Fund positioning
Against this backdrop, the funds are overweight duration overall, with the strongest conviction in the U.S. A significant overweight to U.S. duration drives the broader duration overweight across portfolios. The position is expressed primarily through inflation-linked bonds, where the team views U.S. real yields around 3% as an attractive entry point.
The shift reflects both valuation and the nature of the recent increase in yields. The team does not interpret higher long-end and real yields as a signal of market stress. Rather, as yields have risen without a material increase in volatility or deterioration in market functioning, the prospective return available from holding duration has improved. There is ultimately a level at which higher yields provide sufficient compensation for the underlying risks, and the team believes U.S. markets are increasingly reaching that point.
The team also sees potential technical support for the long end of the U.S. Treasury curve from Treasury buybacks, particularly in the 10-, 20- and 30-year sectors. While these operations do not remove the risks associated with inflation, fiscal issuance or increased corporate supply, the team views the expansion of buybacks as an important development for market liquidity and long-end demand.
Outside the U.S., positioning reflects selective relative-value opportunities rather than a broad regional duration view. In certain mandates, the team is modestly long Japanese duration and short French bonds, expressing a preference for Japanese fixed income relative to France.
Credit market performance
U.S. below-investment-grade credit delivered positive returns in August. The Morningstar LSTA U.S. Leveraged Loan Index returned 0.93%, improving on July as software loans rebounded. The recovery reduced the software sector’s year-to-date loss to 2.60% and narrowed its performance gap with the broader loan market.
High-yield bonds also produced positive returns during the month. Public month-end data for the Bloomberg U.S. Corporate High Yield Index indicate a 0.97% August return, while option-adjusted spreads tightened to approximately 261 basis points. The combination of spread tightening in high yield and the rebound in software-related loans represented an improvement from July, when the floating-rate structure of leveraged loans provided greater protection from rising government bond yields.
Despite stronger index-level performance, dispersion remains important. The rebound in leveraged loans was supported by a sector that had been a significant source of weakness earlier in the year, while high-yield spreads ended August at relatively compressed levels. The team therefore continues to emphasize security selection and income rather than materially increasing broad lower-quality credit exposure.
Index | Yield | Yield m/m | Spread | Spread m/m | Performance (%) | |||
bp | bp | bp | 1m | 3m | YTD | 1Y | ||
Investment Grade | ||||||||
CA | 4.4% | 9 | 91 | 0 | -0.2 | -1.2 | 0.7 | 2.6 |
US | 5.5% | 3 | 80 | 1 | 0.4 | -1.0 | -0.2 | 2.0 |
High Yield |
|
|
|
|
|
|
|
|
CA | 7.2% | 1 | 253 | 2 | 0.4 | 0.6 | 2.0 | 4.2 |
US | 7.6% | -10 | 263 | -22 | 1.0 | 0.9 | 2.6 | 4.8 |
US Leverage Loans | 8.1% | -10 | 420 | -9 | 1.2 | 1.2 | 1.6 | 4.7 |
Source: Bloomberg as of 31st August 2026, performance is reflective of local returns
Commissions, trailing commissions, management fees, and expenses all may be associated with mutual fund investments. Please read the prospectus before investing. The indicated rates of return are the historical annual compounded total returns as of August 31, 2026, including changes in share value and reinvestment of all distributions and does not take into account sales, redemption, distribution, or optional charges or income taxes payable by any security holder that would have reduced returns. Mutual funds are not guaranteed, their values change frequently, and past performance may not be repeated. Index performance does not include the impact of fees, commissions, and expenses that would be payable by investors in the investment products that seek to track an index.
Index performance does not include the impact of fees, commissions, and expenses that would be payable by investors in investment products that seek to track an index.
This document may contain forward-looking information which reflect our or third party current expectations or forecasts of future events. Forward-looking information is inherently subject to, among other things, risks, uncertainties, and assumptions that could cause actual results to differ materially from those expressed herein. These risks, uncertainties and assumptions include, without limitation, general economic, political and market factors, interest and foreign exchange rates, the volatility of equity and capital markets, business competition, technological change, changes in government regulations, changes in tax laws, unexpected judicial or regulatory proceedings and catastrophic events. Please consider these and other factors carefully and not place undue reliance on forward-looking information. The forward-looking information contained herein is current only as of August 31, 2026. There should be no expectation that such information will in all circumstances be updated, supplemented or revised whether as a result of new information, changing circumstances, future events or otherwise.
The content of this commentary (including facts, views, opinions, recommendations, descriptions of or references to, products or securities) is not to be used or construed as investment advice, as an offer to sell or the solicitation of an offer to buy, or an endorsement, recommendation or sponsorship of any entity or security cited. Although we endeavour to ensure its accuracy and completeness, we assume no responsibility for any reliance upon it.
All information is historical and not indicative of future results. Current performance may be lower or higher than the quoted past performance, which cannot guarantee results. Share price, principal value, and return will vary, and you may have a gain or a loss when you sell your shares. Performance assumes reinvestment of distributions and does not account for taxes. Performance may not reflect any expense limitation or subsidies currently in effect. Short-term trading fees may apply.
This material is for informational and educational purposes only. It is not a recommendation of any specific investment product, strategy, or decision, and is not intended to suggest taking or refraining from any course of action. It is not intended to address the needs, circumstances, and objectives of any specific investor. Mackenzie Investments, which earns fees when clients select its products and services, is not offering impartial advice in a fiduciary capacity in providing this sales and marketing material. This information is not meant as tax or legal advice. Investors should consult a professional advisor before making investment and financial decisions and for more information on tax rules and other laws, which are complex and subject to change.
The rate of return is used only to illustrate the effects of the compound growth rate and is not intended to reflect future values of the mutual fund or returns on investment in the mutual fund.