
Reducing equity risk is a well-established portfolio management practice, particularly as a buffer against market dislocations. This can be achieved either by reallocating capital away from equity toward lower-volatility asset classes — such as fixed income — or by refining equity exposure itself. The latter includes strategies like minimum volatility portfolios, low-beta sectors and tail-risk hedging. While these approaches differ in implementation, they share a common objective: mitigating total portfolio risk. Historically, this has been viewed as necessitating a trade-off — lower portfolio risk in exchange for diminished long-term returns. However, this perceived trade-off is worth re-examining.
Risk-return profile
The MSCI World Minimum Volatility Index (CAD) has delivered on its promise of lower risk. The average annual standard deviation of the MSCI World Index going back to 2002 is about 11.9%; over the same period the MSCI World Minimum Volatility is closer to 9.3%. However, over the past two decades, investors have not really had to sacrifice significant returns to achieve this lower risk. From December 2004 to March 2025, the average rolling five-year total return of the MSCI World Index (CAD) was 7.21%, while the MSCI World Minimum Volatility Index was 6.97%, a negligible difference of 0.24% and a meaningful improvement in risk-adjusted return.
Figure 1 – Comparison of the rolling five-year return of MSCI World Index and MSCI World Minimum Volatility Index
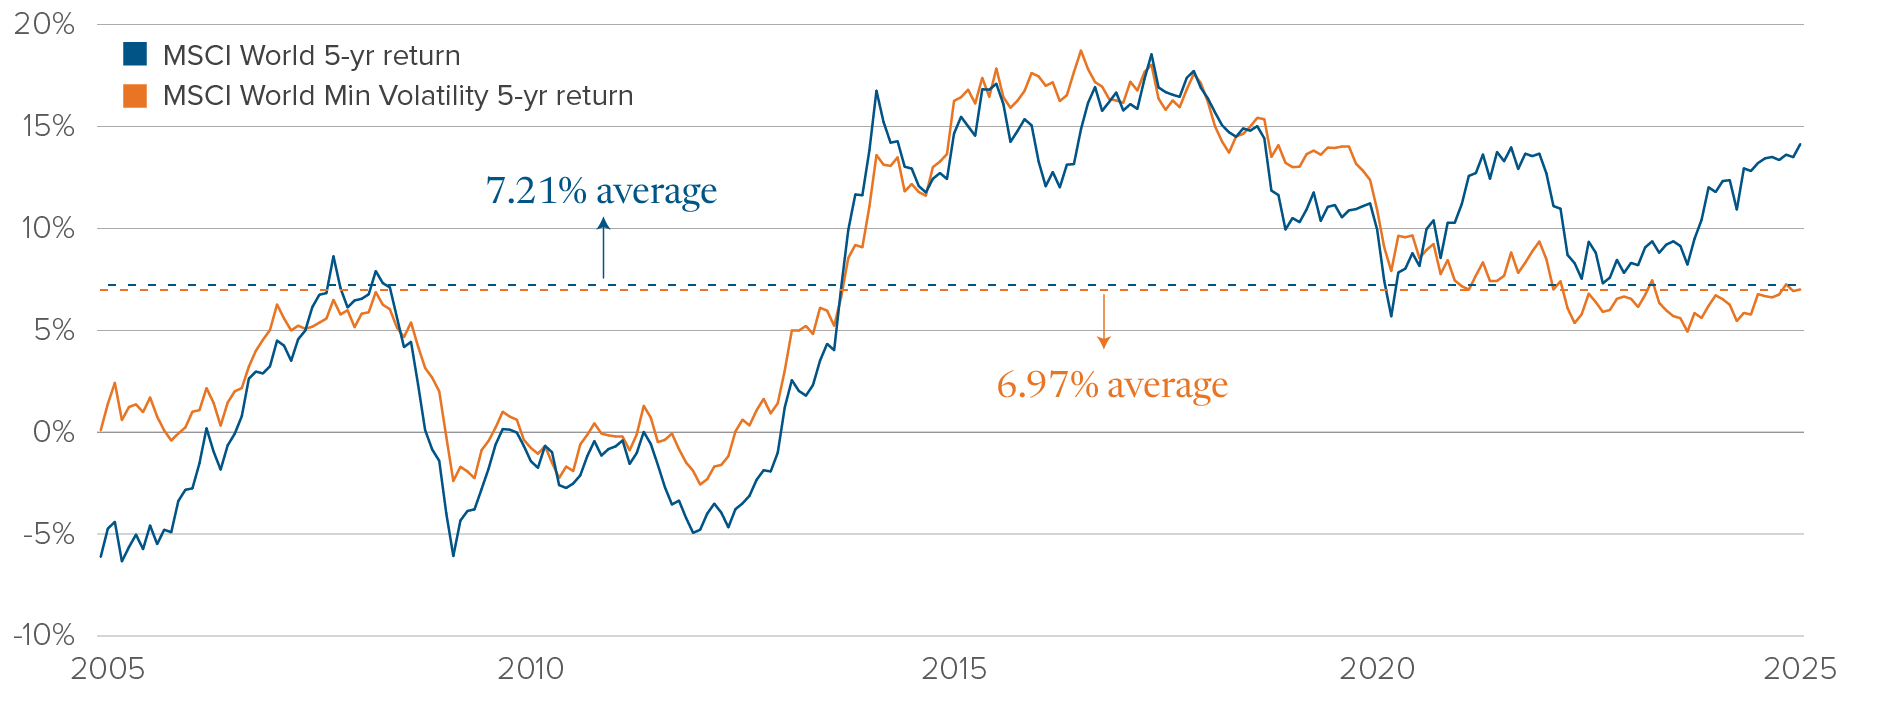 Source: Morningstar, as at March 31, 2025.
Downside risk mitigation
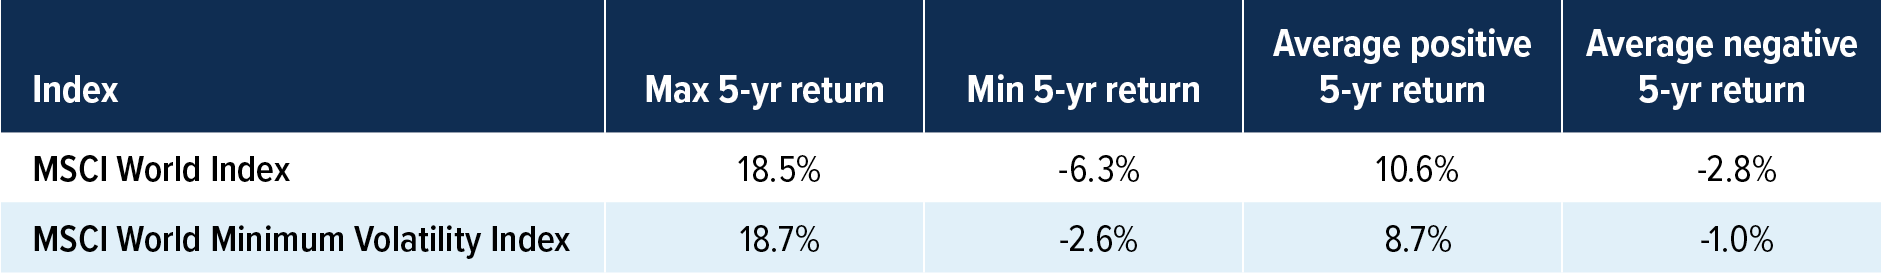
The MSCI World Minimum Volatility Index performs well in downside markets, as it is designed to do. We can examine investor experience by looking separately at all periods in which returns were positive or negative. From 2002 to 2025, the average of all negative 5-year returns for the MSCI World Index was -2.8%, compared to -1.0% for the MSCI World Minimum Volatility Index. Looking only at the worst-case, the MSCI World Index had a 5-year return of -6.3% (27.7% cumulative loss), while the MSCI World Minimum Volatility Index had a worst 5-year return of -2.6% (12.3% cumulative loss), less than half of the total loss.
 Source: Morningstar, as at March 31, 2025.
Consistency of outperformance
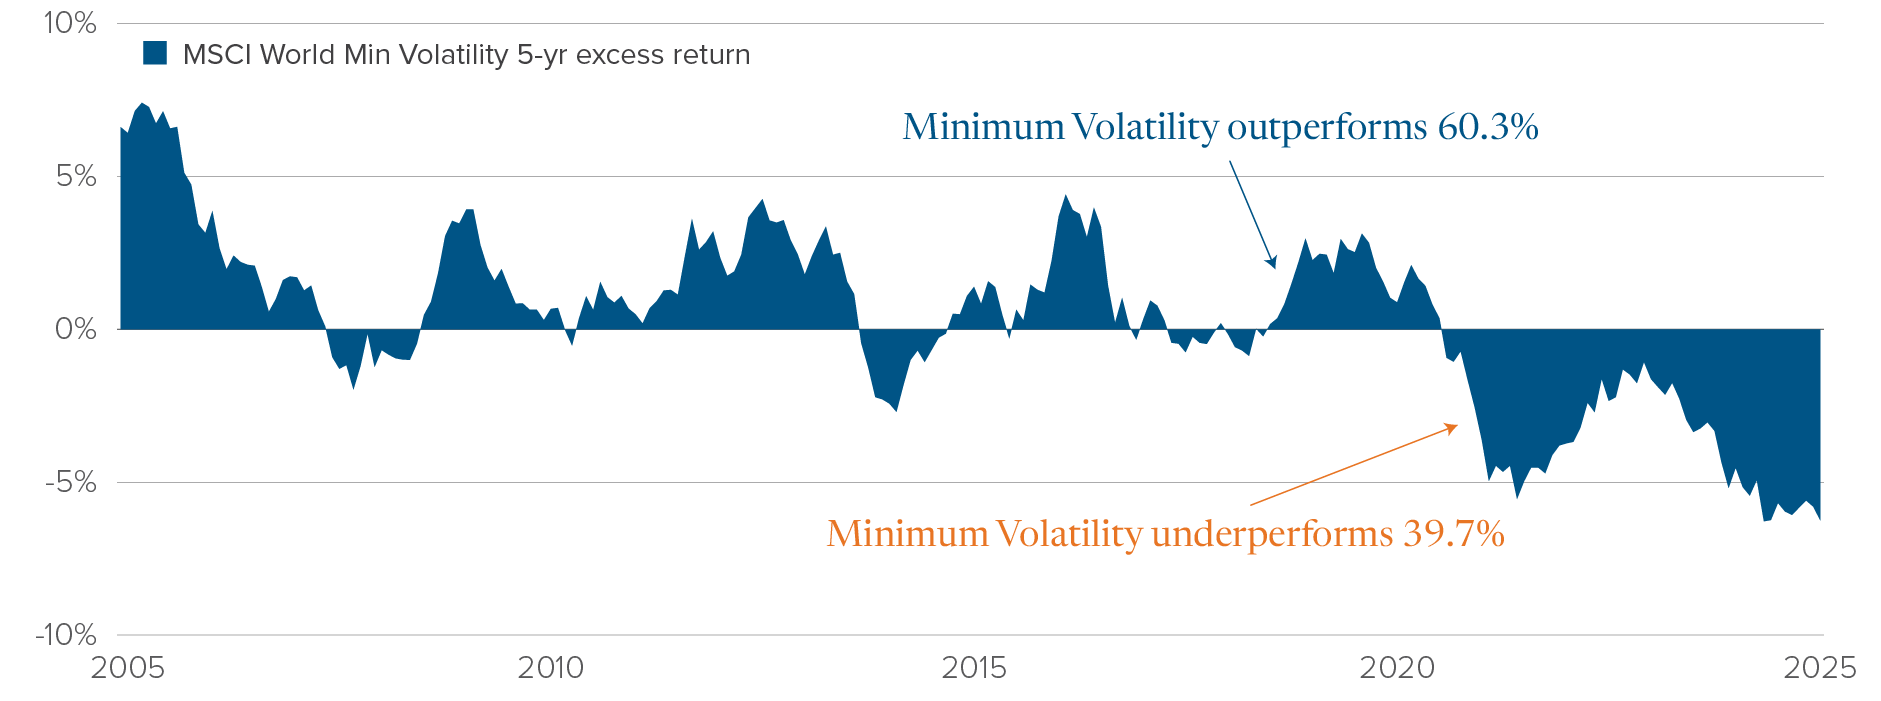
The consistency of outperformance of low volatility investing is also compelling. Over the full period studied, the MSCI World Minimum Volatility Index outperformed the broader MSCI World Index in 60.3% of all rolling five-year periods, indicating a meaningful edge. This outperformance was not limited to specific market conditions; rather, it was observed across various market environments. The consistency of this edge suggests that low volatility strategies can provide a reliable means of managing portfolio risk while consistently contributing positively to total return.
Figure 2 – Excess returns of the MSCI World Minimum Volatility Index
(Min Vol) over the MSCI World Index
 Source: Morningstar, as at March 31, 2025.
Sector composition and risk reduction
The MSCI World Minimum Volatility Index achieves lower overall risk in part through its sector composition, reducing exposure to more volatile areas of the market and increasing exposure to sectors with historically stable returns.
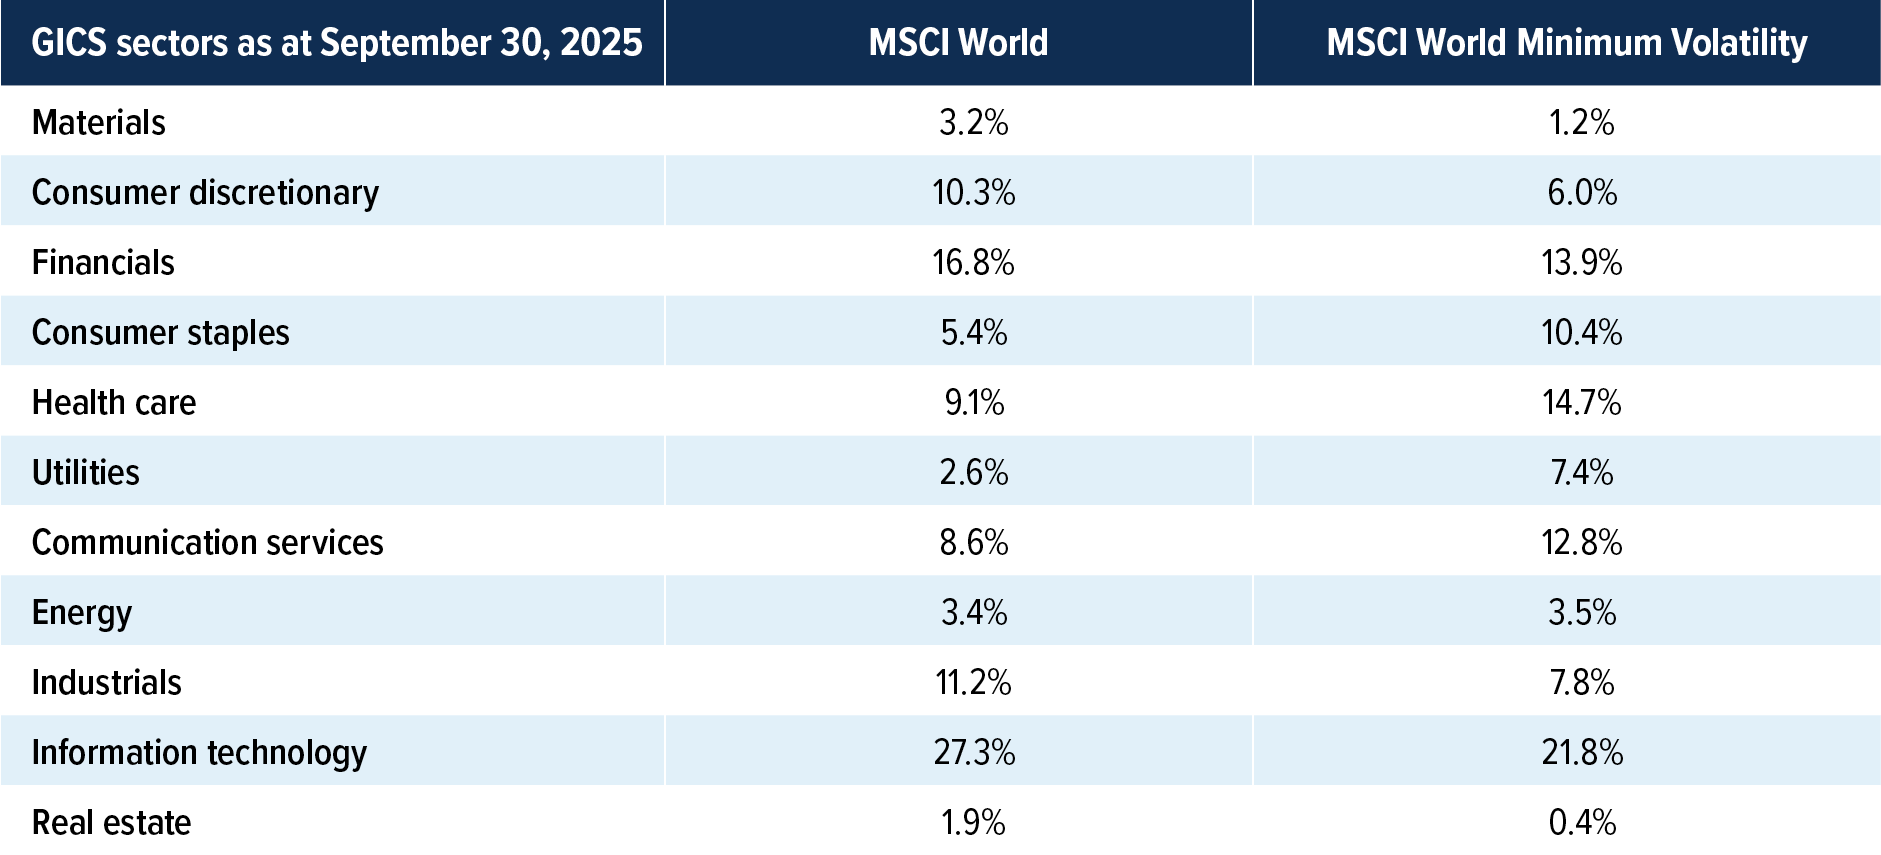
This sector tilt is a key mechanism behind the Minimum Volatility Index’s ability to deliver similar equity returns with less risk.
The case for low volatility strategies
Low volatility investing is not about sacrificing returns for risk reduction; it is about achieving more efficient exposure to equity markets. By capturing most of the upside while avoiding a significant portion of the downside, low volatility strategies offer a compelling alternative to simply reducing equity exposure. In a world where volatility is increasingly a feature, not a bug, this approach is worth considering.
Commissions, trailing commissions, management fees and expenses all may be associated with mutual fund investments. Please read the prospectus before investing. Mutual funds are not guaranteed, their values change frequently and past performance may not be repeated.
The content of this article (including facts, views, opinions, recommendations, descriptions of or references to, products or securities) is not to be used or construed as investment advice, as an offer to sell or the solicitation of an offer to buy, or an endorsement, recommendation or sponsorship of any entity or security cited. Although we endeavour to ensure its accuracy and completeness, we assume no responsibility for any reliance upon it.
This article may contain forward-looking information which reflect our or third party current expectations or forecasts of future events. Forward-looking information is inherently subject to, among other things, risks, uncertainties and assumptions that could cause actual results to differ materially from those expressed herein. These risks, uncertainties and assumptions include, without limitation, general economic, political and market factors, interest and foreign exchange rates, the volatility of equity and capital markets, business competition, technological change, changes in government regulations, changes in tax laws, unexpected judicial or regulatory proceedings and catastrophic events. Please consider these and other factors carefully and not place undue reliance on forward-looking information. The forward-looking information contained herein is current only as of September 30, 2025. There should be no expectation that such information will in all circumstances be updated, supplemented or revised whether as a result of new information, changing circumstances, future events or otherwise.
Index performance does not include the impact of fees, commissions, and expenses that would be payable by investors in the investment products that seek to track an index.
Standard deviation provides a measure of the variability of returns that have occurred relative to the average return. The higher the standard deviation, the greater is the range of returns that has been experienced. Standard deviation is commonly used as a measure of risk.