
Highlights
- The global economy is witnessing an unprecedented race to deploy roughly $7 trillion toward AI infrastructure.
- It is entirely possible that the scale of infrastructure being built will exceed near-term AI demand.
- The timeline for AI to transition from a request-response model (akin to search engines) to an agentic-workflow model (assigning tasks and returning complete solutions) remains uncertain.
- As with other technological breakthroughs (such as Edison’s mastery of electricity) many future AI applications may only be clear in hindsight.
Much of the current market and economic narrative revolves around the surge in AI-related capital expenditure. Investors are increasingly drawing comparisons to the late-1990s tech boom and questioning whether we are entering bubble territory.
Skeptics highlight similarities to the 1990–2001 dot-com buildout, emphasizing hallmarks of past bubbles: excessive speculation, leverage, momentum-driven prices detached from fundamentals, and assets producing no cash flows (akin to tulips, levered US residential investment and revenue free dot-coms).
Supporters counter that today’s AI investment cycle bears little resemblance to the dot-com period. The spending is financed largely from the cash flows of some of the most profitable companies in history (Microsoft, Google, Amazon and Meta generated $350 billion in revenue in Q1 2025 alone). Moreover, AI assets are already generating meaningful value: Azure AI services generate billions in revenue, ChatGPT has millions of paying subscribers and enterprises are integrating AI into core workflows.
After reviewing multiple research paper and industry analyses, I think the truth likely lies somewhere in the middle.
Innovation happens
In 1882, Thomas Edison’s experimentation with electricity allowed Pearl Street Station to power lighting in Lower Manhattan, setting off a decades-long wave of innovation that includes lighting, television, refrigeration, computing and AI. Yet, Edison died in 1931, before television, the personal computer and the internet, decades before many of the applications that ultimately justified the enormous capital invested in the electrical grid. Clearly, Edison could not have foreseen all the applications that followed from his development of electricity.
The broader pattern is clear: capex comes first; utility and adoption follow. The extent to which large scale technological innovation changes processes cannot be predicted accurately in advance. As with electricity, we can make educated guesses about future AI applications, but we cannot fully predict what AI will unlock. Potential breakthroughs may include:
- Personalized medicine, where AI designs treatment protocols tailored to one’s exact genetic makeup.
- Real-time supply chain optimization where millions of routing, inventory and logistics decisions are calculated with near perfect information from satellites, sensors and weather data.
- Hyper-personalized education where each student has an AI tutor adapting in real-time to their learning style.
- Predictive infrastructure maintenance where cities anticipate bridge failures and power outages before they happen.
Will all, or any, of these materialize? At present, we don’t have a fulsome understanding of the extent to which AI technology might have utility in our professional and personal lives. We can sense though, that this new technology has the potential to be transformative. In what way, shape and form, and over what timeframe, remains to be seen.
Steve Jobs said it best when he noted that, “as it relates to innovation, you can only connect the dots looking backward.”
An AI update
How much money is being spent on building AI infrastructure?
Annualized AI Hardware Spending in US National Accounts
Change vs. 2022 ($ billions)
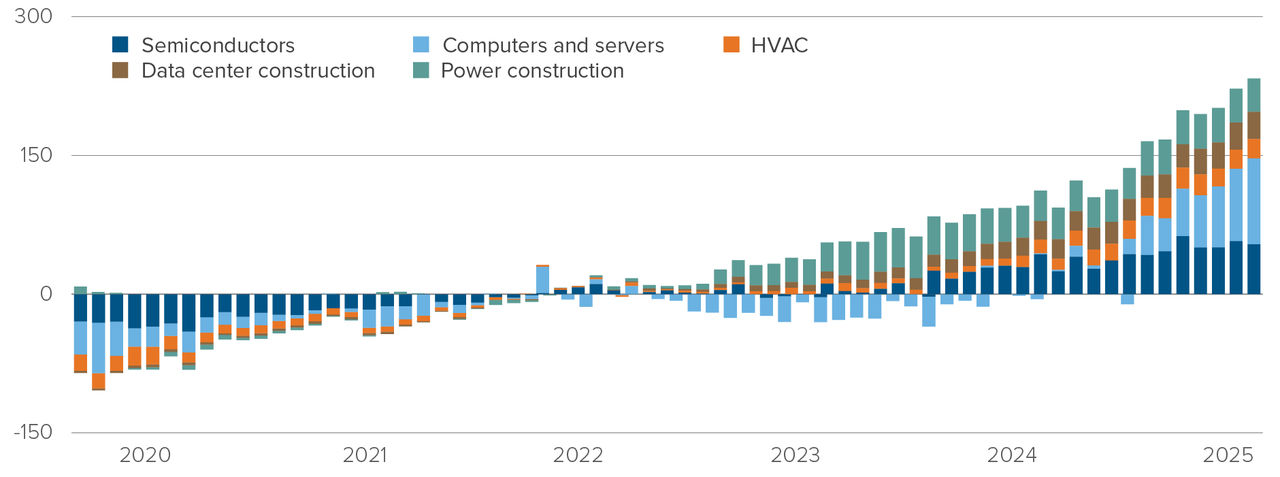
Source: Goldman Sachs Global Investment Research, Compustat, Bureau of Economic Analysis
Figure 1 illustrates the rapid and sustained increase in spending on all facets of the AI foundation. That includes hardware (semiconductors, computers and servers), data centres and power supplies. Relative to the base year (2022), spending has risen by approximately $277 billion and continues to accelerate.
The AI impact:
AI influences the US economy in at least two ways:
- Productivity gains, as businesses integrate AI into operations.
- Massive capital spending, required to build AI infrastructure.
Productivity gains:
The growth in real GDP is a function of both population growth and productivity. Economic growth occurs when the quantities of the factors of production grow or when persistent advances in technology make them increasingly productive. Labour productivity, which is the quantity of real GDP produced by one hour of labour, is influenced by savings and investment in physical capital, expansion of human capital and the discovery of new technologies. These factors contribute to the growth of labour productivity, which in turn contributes to the growth of real GDP.
Proponents of AI as transformational technology expect meaningful productivity gains as adoption spreads. But the magnitude and timing remain uncertain.
Estimated Effect of Generative AI Adoption on Labour Productivity -
Academic Studies
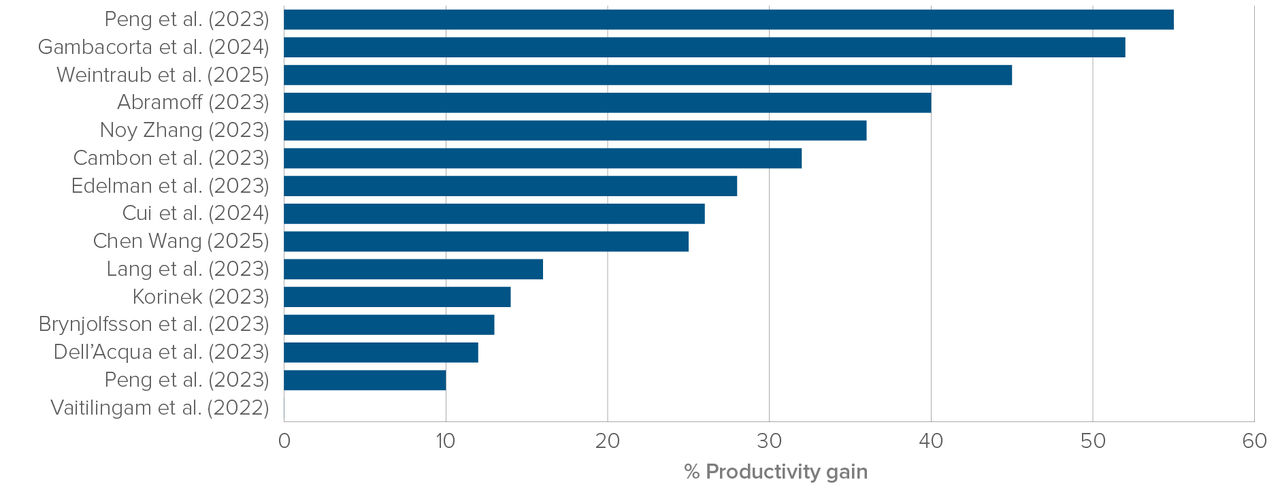
Source: Goldman Sachs Global Investment Research
Academic studies suggest AI could drive substantial improvement in productivity, as exhibited in figure 3 below.
Estimated Effect of Generative AI Adoption on Labour Productivity -
Company Anecdotes
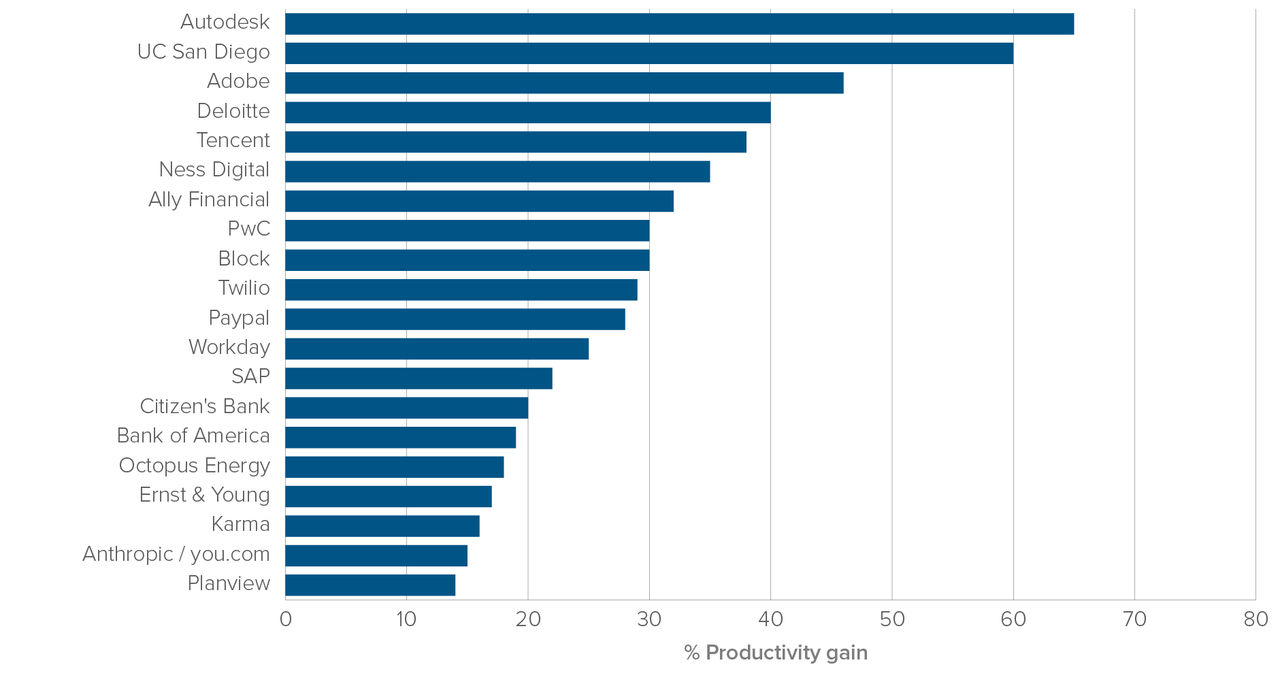
Source: Goldman Sachs Global Investment Research
Corporate surveys similarly indicate broad expectations of productivity enhancements across industries.
A quote from the Goldman Sachs research report sums up the intuition from these two graphs:
“Academic studies and company anecdotes point to 25%-30% average productivity gains following the deployment of AI applications…we estimate that only 2.5% of employment is at risk of automation from current applications, which primarily focus on coding, customer service and consulting support — and the average impact will likely moderate as applications broaden to job functions that are harder to automate. But these early estimates highlight the potential for generative AI to deliver transformative productivity uplifts when appropriately deployed”.
While encouraging, these estimates should be viewed as educated estimates, not forecasts. Productivity gains will likely take time — potentially years — to fully materialize.
Spending to build the AI infrastructure:
Core investment areas include:
- Computer infrastructure (hardware and cloud capability) — includes high performance GPUs, networking hardware and cloud storage capability.
- Data infrastructure and management — everything required to collect, clean, store, label, move and govern the data that AI relies on.
- Power and cooling systems — the hardware required to absorb the vast energy needs of these new tools.
- Software, development tools and licensing — licensing, subscriptions and development of the AI platform and ecosystem.
Capital needs are enormous. For instance, the top spenders on AI in 2025 are exhibited in Figure 4:
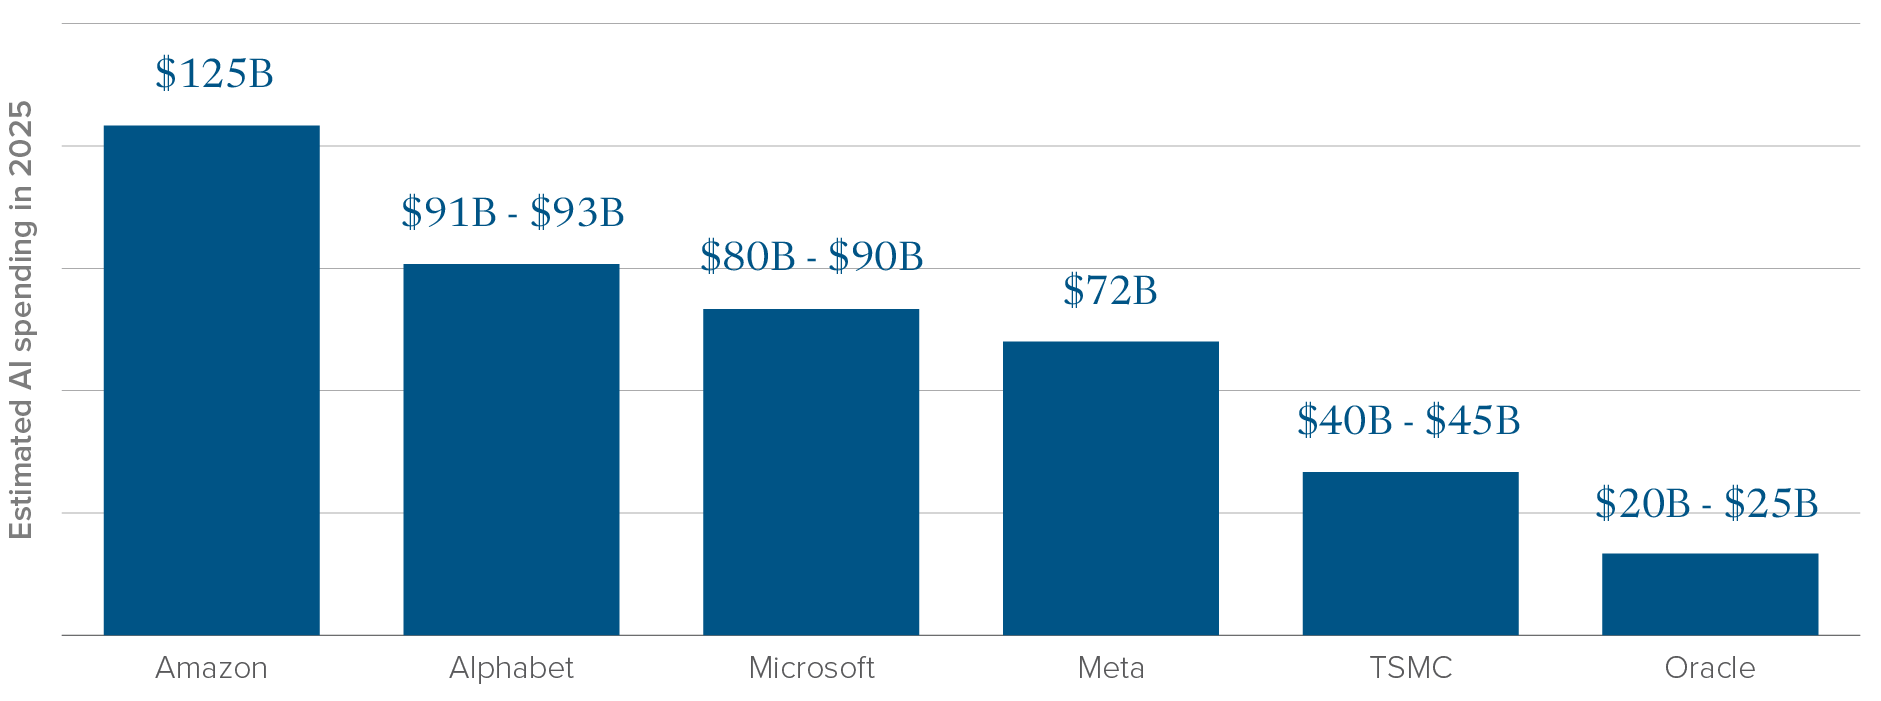
Source: Company financial reports, earnings calls, investor presentations and press releases.
The surge in investment has already supported US GDP growth. Indeed, some argue that the US avoided a sharper economic slowdown in 2024–2025 thanks in part to AI infrastructure spending. Figure 5 shows the important contribution to real GDP of spending on AI.
Contribution to GDP Growth
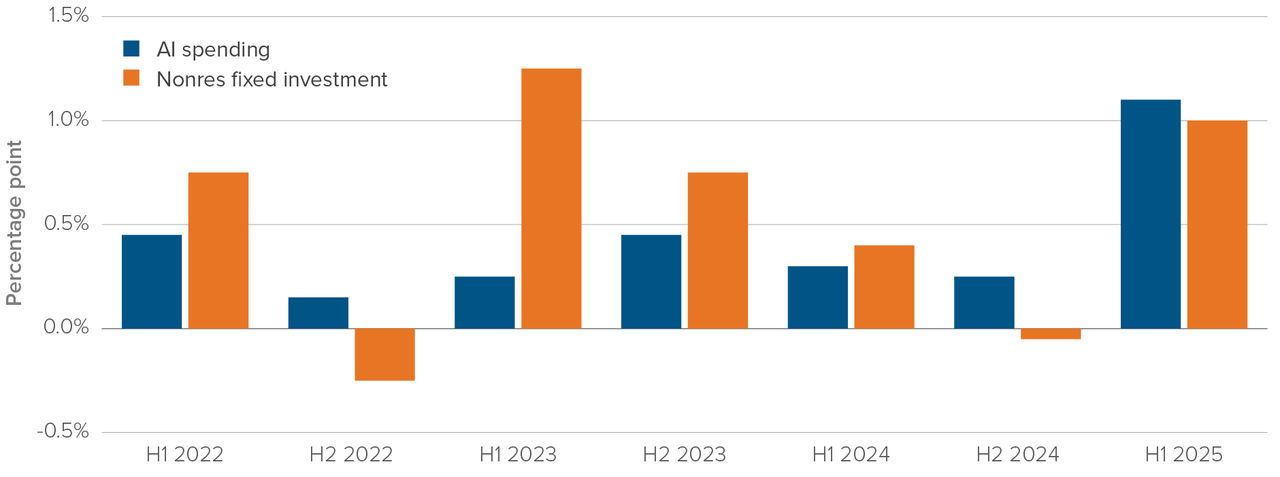
Source: BEA, Haver Analytics, Morgan Stanley Research
AI spending has clearly become a major contributor to GDP growth, particularly in 2025.
The key questions investors are currently wrestling with are: “Is this an overspend and will spending outstrip demand?” Figure 6 compares current AI investment spending with that of previous transformational eras.
Peak Historical Investment Impulse, Emerging Technologies
in Frontier Economies
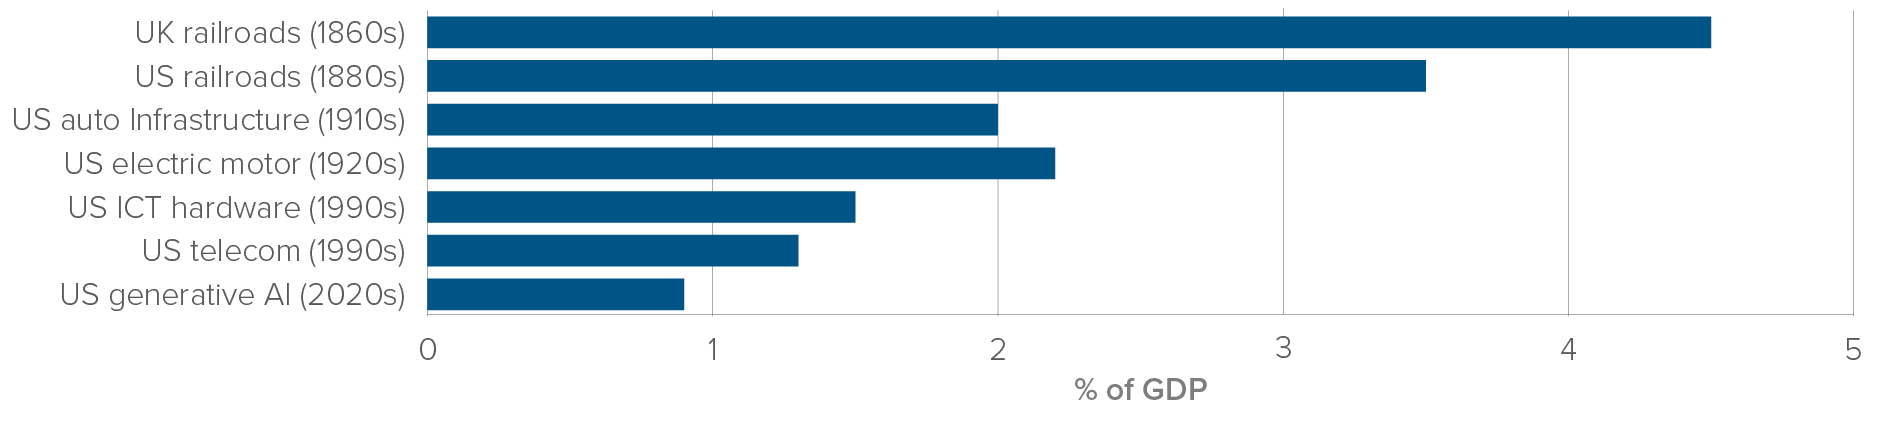
Source: Goldman Sachs Global Investment Research, Bureau of Economic Analysis
What we can see from this chart is that, historically infrastructure investment impulses have generally peaked at 2%–5% of GDP; electrification and the 1990s IT boom peaked at about 1.5%–2.0% of GDP. By contrast, AI investment in the US over the past year remains below 1% of GDP, a large but not outsized impulse by historical standards.
Related party interdependence and systemic risk:
A growing concern is the increasing interdependence among major AI players:
- NVIDIA is supplying massive GPU infrastructure to OpenAI while also investing up to $100 billion in the company, creating a tightly intertwined supplier-investor relationship.
- AMD has a multi-year chip deal with OpenAI that includes warrants allowing Open AI to acquire up to 10% of AMD’s shares, linking the two companies financially beyond a normal vendor contract.
These cross-financial relationships could amplify systemic risk. What would happen, for example, if OpenAI suffered a sharp downturn in its business? For NVIDIA, the effect, given its new interdependence with OpenAI, would be two-fold. The primary effect would be a reduction in demand for the chips that it supplies to OpenAI. The secondary effect would be losses on its ownership stake in OpenAI. NVIDIA in this situation is affected both as a supplier of chips to and an owner of a stake in OpenAI.
The feedback loop would intensify across the industry, raising the potential for broader contagion. As firms become more interconnected, investors must consider the rising possibility of correlated failures.
Conclusion:
We may be in the early stages of a transformational technology era. Consider these perspectives:
- The technology: AI tools promise to enhance productivity and reshape both professional and personal workflows. While many future applications remain unknown, AI’s long-term relevance is unquestionable. The pace of adoption, however, is uncertain.
- The spending: AI investment will provide a meaningful tailwind to GDP in the coming years. While forecasts for productivity gains remain speculative, the capex is real and substantial. Importantly, current spending levels do not appear excessive relative to past technological revolutions.
- The stocks: AI-centric equities, especially the “Magnificent7”, are not classic bubble candidates, but expectations are undeniably high. NVIDIA and Microsoft are priced for continued rapid AI adoption; others such as Apple and Tesla, are less dependent on AI-driven growth. Concentration risk is meaningful. A collapse is unlikely, but a valuation reset could occur if AI adoption slows.
Investors would be wise to proceed with caution given how far equity markets have come over the recent past. As this powerful but uncertain technological cycle unfolds, it is prudent to stick to the well-worn principles of diversification, valuation discipline and patience.
Multi-Asset Strategies Team’s investment views
Tactical summary
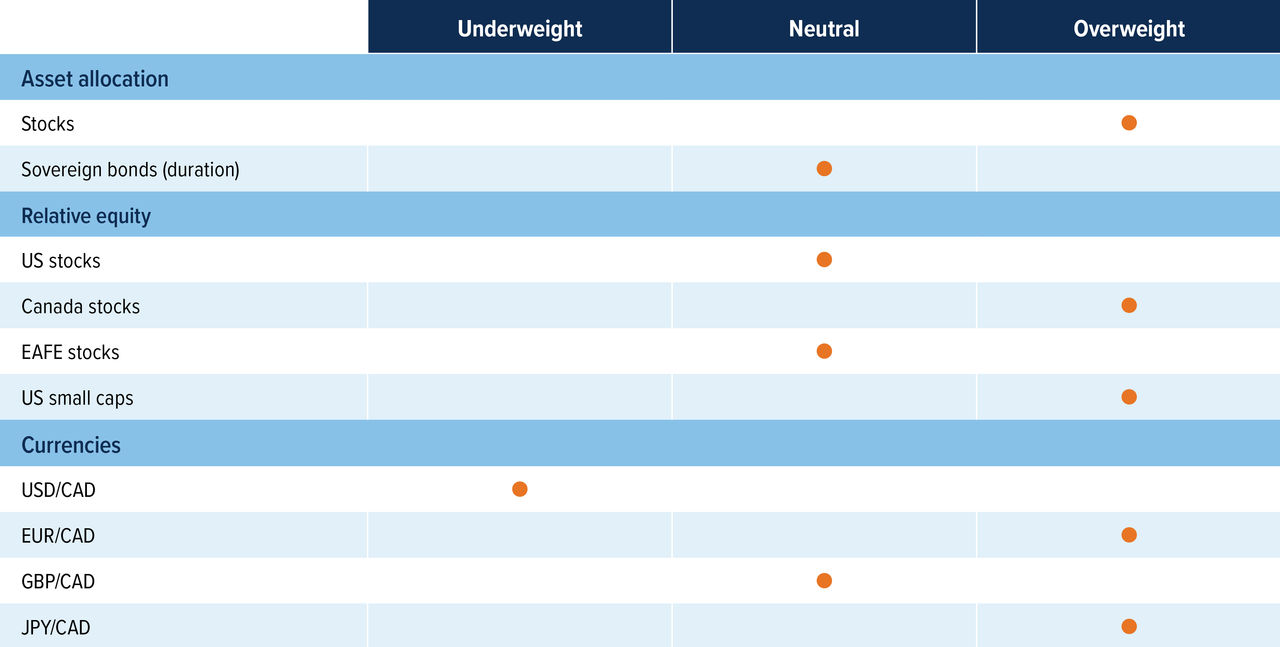
Source: Mackenzie Investments.
Note: The opinions expressed in this piece reflect short-term tactical views, which inform the positioning of some of the funds managed by the Multi-Asset Strategies Team.
Positioning highlights
Back to neutral on duration: The Federal Reserve continues to signal that inflation remains above its target, despite a slowdown in the job market. Markets are currently pricing in at least three rate cuts by the end of 2026, which we consider to be a reasonable estimate. Therefore, there is no need to increase duration at this time. For now, we are awaiting the announcement of the new Fed Chair to assess any potential market reactions.
Stocks allure returns: Earnings season in the US has ended strongly with Nvidia beating estimates. Despite the strong report, AI names have lagged as overvaluation concerns remain. However, non-AI names have continued to perform strongly and we believe they will help lift the market overall.
Are we increasing our positioning in the international space? Our view on US/Canada vs. international equities is more nuanced than usual. Tactically, we've recently shifted to a neutral stance on US equities (from an underweight), and we have not made any broad-based increases in international exposure. However, we’ve made selective regional adjustments to our positioning. For example, we’ve reallocated some exposure from Europe to Canada. That said, we continue to see strong valuation support in Japan, and from a long-term perspective, EAFE and emerging markets remain more attractive than the US or Canada on a pure value basis.
Buy Canada? Canadian economic data has strengthened recently with 66,600 jobs created in October compared to expectations of -5,000. This indicates that the economy is not collapsing; however, the case for rate cuts still remains on the table, creating an environment that should be supportive for domestic equities. At the same time, strength in financials and gold has led to upward revisions in Canadian earnings forecasts, providing an additional tailwind for the broader market.
Currencies: We moved from underweight to neutral GBP because the UK’s November budget removed a key tail-risk premium by signalling fiscal discipline, which helped stabilise gilt yields and supported a steadier currency backdrop. USD remains overvalued, and our long-term view is for the USD to depreciate versus most developed countries.