
Highlights
- The wealthiest Americans have seen exceptionally strong income and asset growth, while most of the population have experienced modest gains or stagnation.
- Strong growth among the wealthiest 10% has supported surprisingly robust overall consumption, which may be the cause of stronger than expected economic growth.
- The growing gap between the haves and the have-nots carries significant longer-term implications, including heightened risks of political polarization and social unrest.
Introduction
There has always been inequality in society.
At the centre of the capitalist dream is the belief that opportunity is broadly accessible, that individuals can improve their circumstances through effort, innovation and risk-taking. There is no promise, however, that economic output will be shared equally, as is the case in other systems such as communism or socialism. Instead, capitalism is founded on a form of meritocracy, where individuals move into positions of success, power and influence based on their demonstrated abilities, initiative and, at times, good fortune.
It is taken as a given, and often celebrated, that some members of society will accumulate significant income and wealth while others will not. Income and asset inequality is frequently cited as proof that the system works. The narrative of investing in the American Dream and achieving one’s aspirations remains a powerful cultural and economic force.
Yet there are many, many Americans who are left behind. In fact, a large proportion of the population struggles to maintain financial stability, facing persistent obstacles to upward mobility. Rising housing costs, uneven wage growth, limited access to capital, and increasingly expensive education and health care all weigh heavily on the prospects of advancement. The very existence of those who struggle is, paradoxically, the other side of the American Dream. There can be no outsized winners without relative losers.
By accepting inequality as an inherent feature of the system, society also accepts the possibility, real or perceived, that through effort, opportunity or serendipity, individuals can move up the socioeconomic ladder. This belief remains central to economic optimism, even as the empirical reality has become more uneven.
This inequality is clearly visible today. The popular press has coined the term “K-shaped economy” to describe how the most affluent Americans have benefited from strong income and wealth growth over the past several years, while lower-income households have struggled to keep pace. The upward-sloping arm of the “K” represents the wealthy, while the downward-sloping arm captures those left behind.
Market observers argue that overall economic growth has remained resilient precisely because higher-income households have seen outsized gains and tend to spend a disproportionate share of their income and wealth. Despite repeated expectations of recession over the past three years, stemming from aggressive interest rate hikes in 2023 and 2024, and the dampening effect of higher tariffs in 2025, the US economy has remained unexpectedly robust. This raises a critical question: have upper-income earners effectively kept the economy afloat?
This article will not delve in to the moral or ethical debates surrounding income inequality. Instead, it seeks to understand the extent to which a K-shaped economy currently exists and to assess its implications for economic growth as we move forward.
The gap between the haves and the have-nots:
The term “K-shaped economy” emerged in the wake of the COVID-19 crisis to describe a sharp divergence in economic outcomes across society. Some segments rebounded quickly, while others experienced prolonged hardship. The K-shape illustrated a bifurcated recovery path: higher-income households benefited from remote work flexibility, rapid asset price appreciation and accelerated digital transformation, while lower-wage workers faced job losses, income instability and disproportionate financial stress.
While COVID-19 made this divergence more visible, the rise in inequality in the US is part of a much longer-term trend. Figure 1 (below) shows that income inequality, as measured by the Gini coefficient, has risen steadily since approximately 1980.
US income Gini coefficient
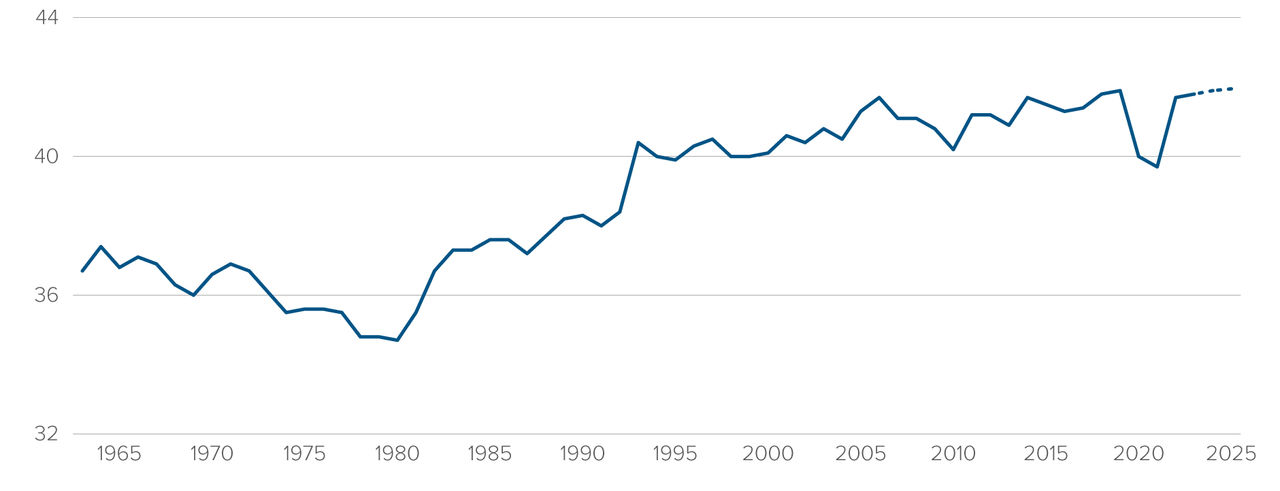
Figure 1
Source: US Bank Economics; Bloomberg; World Bank; Census ACS (2024 Est.); Statistica (2025 Est.)
Note: A Gini coefficient of 0 reflects perfect equality, where all income or wealth values are the same. A Gini coefficient of 1 (or 100%) reflects maximal inequality, where a single individual has all the income while all others have none
The Gini coefficient measures inequality within a distribution, such as income or wealth. A Gini coefficient of 0 reflects perfect equality, where all incomes are the same, while a coefficient of 1 represents perfect inequality. The persistent upward trend in this measure underscores that, in income terms, America has become increasingly divided over the past several decades.
This trend is not perfectly linear. During the pandemic, unusually large government transfer programs temporarily altered the distribution of income. Between 2019 – 2021, lower-income households experienced income growth after taxes and transfers that was comparable to that of upper-income earners, as shown in Figure 2.
Cumulative growth in average household income by quintile
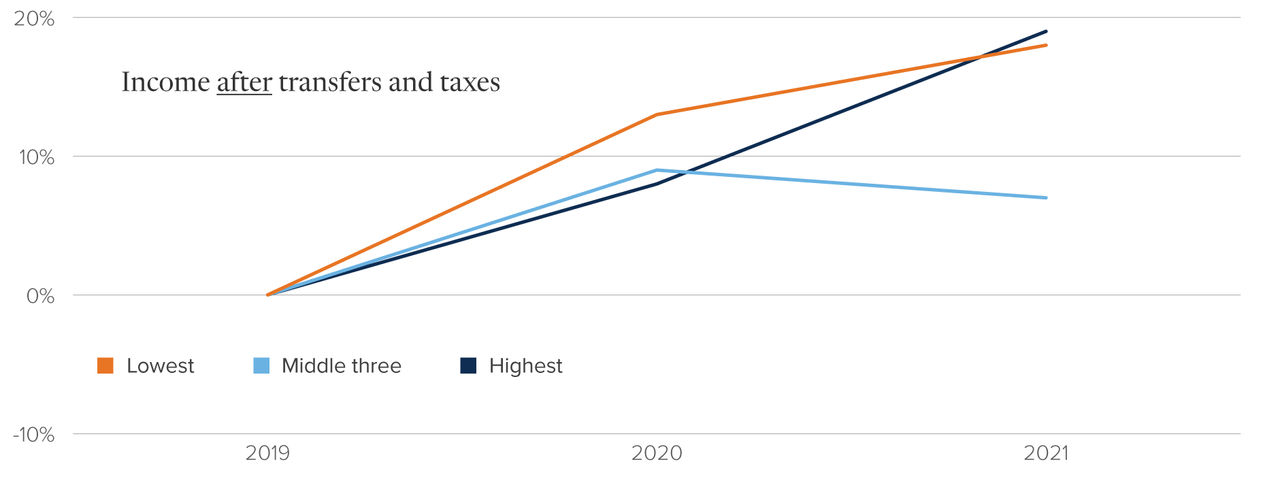
Figure 2
Source: US Bank Economics; Congressional Budget Office (CBO)
The scale of the COVID-19 shock compelled policymakers to deliver financial support to the most vulnerable households. While effective in the short-term, these measures proved temporary. Figure 3 highlights that income inequality quickly reversed and moved higher once emergency programs were withdrawn.
US income Gini coefficient
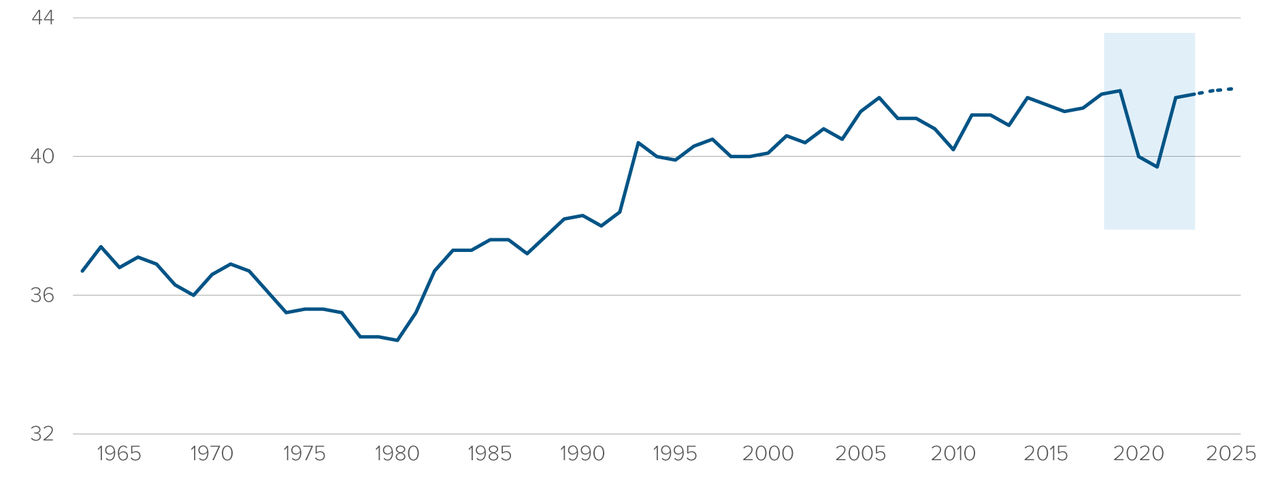
Figure 3
Source: US Bank Economics; Bloomberg; World Bank; Census ACS (2024 Est.); Statistica (2025 Est.)
Note: A Gini coefficient of 0 reflects perfect equality, where all income or wealth values are the same. A Gini coefficient of 1 (or 100%) reflects maximal inequality, where a single individual has all the income while all others have none
After a brief dip in the Gini coefficient around 2020, signaling greater equality, the longer-term trend reasserted itself, with inequality widening again after 2021.
Income inequality is not unique to the US. Canada has experienced a similar, though less pronounced, pattern. Figure 4 shows that financial asset and income growth has been disproportionately strong among higher-income quintiles in Canada as well. Notably, however, spending behaviour across income groups has been more uniform than in the US, suggesting important cross-country differences in consumption dynamics.
No “K” in Canadian spending, but there is in income and wealth
Inflation-adjusted annualized change by income quintile (% Q2 2022 - Q2 2025)
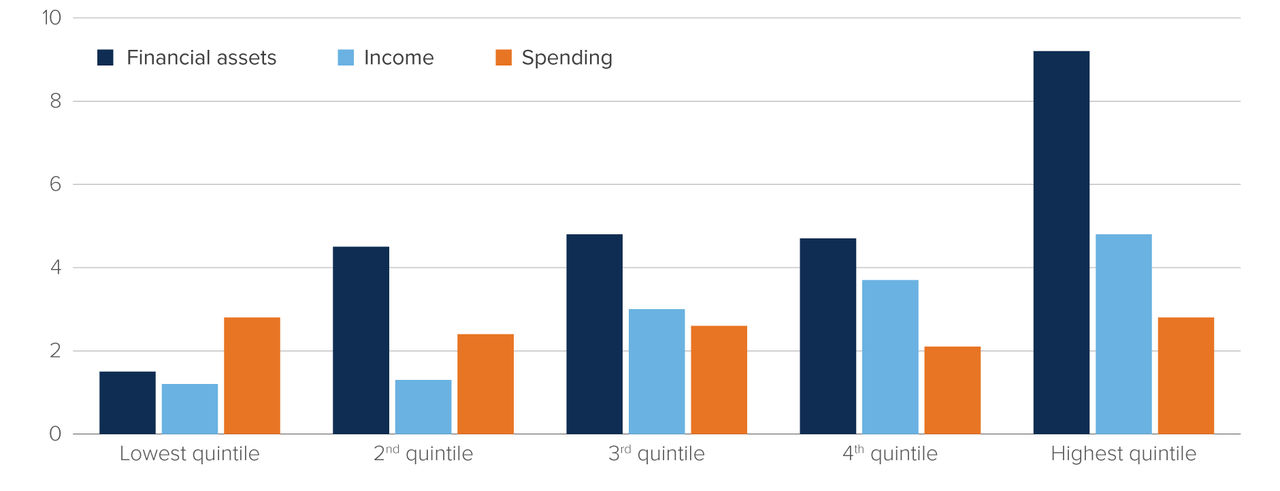
Figure 4
Source: Statistics Canada, CIBC
The wealthy keep spending:
The public policy implications of rising income and asset concentration are substantial, but they fall outside the scope of this paper. What is directly relevant, however, is the growing divergence in spending behaviour across income groups, and the implications for economic growth.
The top 40% of income earners in the US own approximately 84% of total assets, including 94% of corporate equities and mutual fund shares, and they account for roughly 61% of total consumption expenditures. This concentration means that shifts in spending behaviour among higher-income households have outsized impact on aggregate demand.
In recent years, those upper-income households have been spending aggressively. Strong equity market performance, with the S&P 500 and Nasdaq rising 16% and 20% respectively in 2025, combined with tax reductions under the One Big Beautiful Bill Act, has boosted disposable income and household balance sheets. Figure 5 illustrates the contribution of upper-income consumption, AI investment and other factors to real GDP growth.
Contribution to US growth
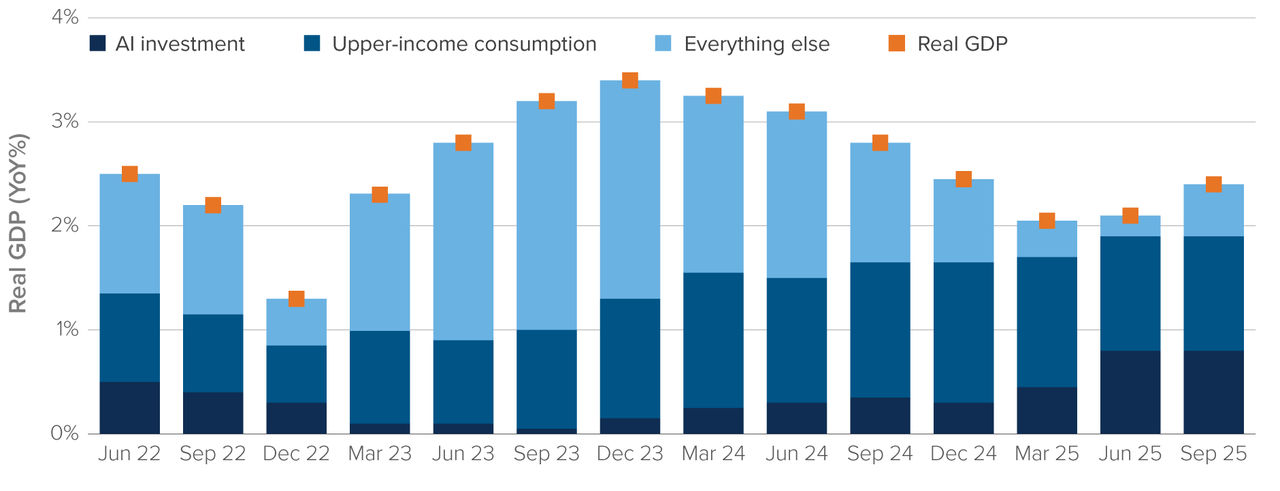
Figure 5
Source: UBS, Haver
This chart shows that upper-income consumption was the single largest contributor to real GDP growth in the latter part of 2025, surpassing even AI-related investment. This highlights just how dependent recent growth has been on the spending behaviour of affluent households.
The same dynamic can be seen in Figure 6 which shows that spending growth among high income earners far outpaced that of middle- and lower-income households in 2025.
The widening gap between higher and lower income households’ spending growth
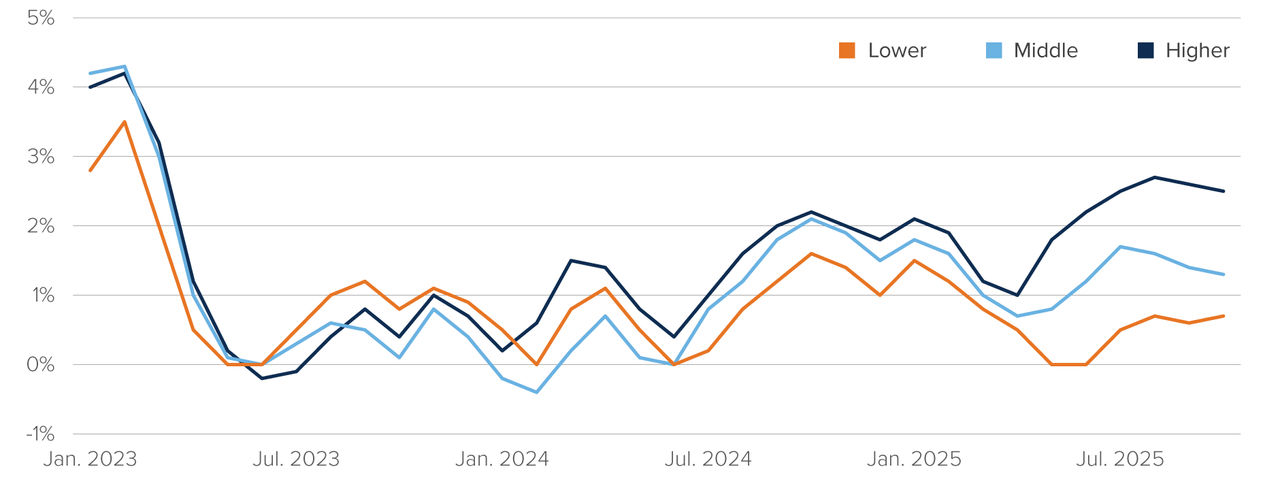
Figure 6
Source: Bank of America. Total credit and debit card spending per household, according to Bank of America card data, by household income terciles (3-month moving average, YoY%, SA)
As discussed earlier, there are several reasons why upper-income households have been able to sustain elevated spending levels, including strong asset appreciation, relatively low leverage and greater insulation from higher interest rates. Figure 7 (below) points to outsized wage growth as a key contributor to outsized spending by upper-income households.
A similar story of widening gaps between high- and lower-income households has played out in wage growth
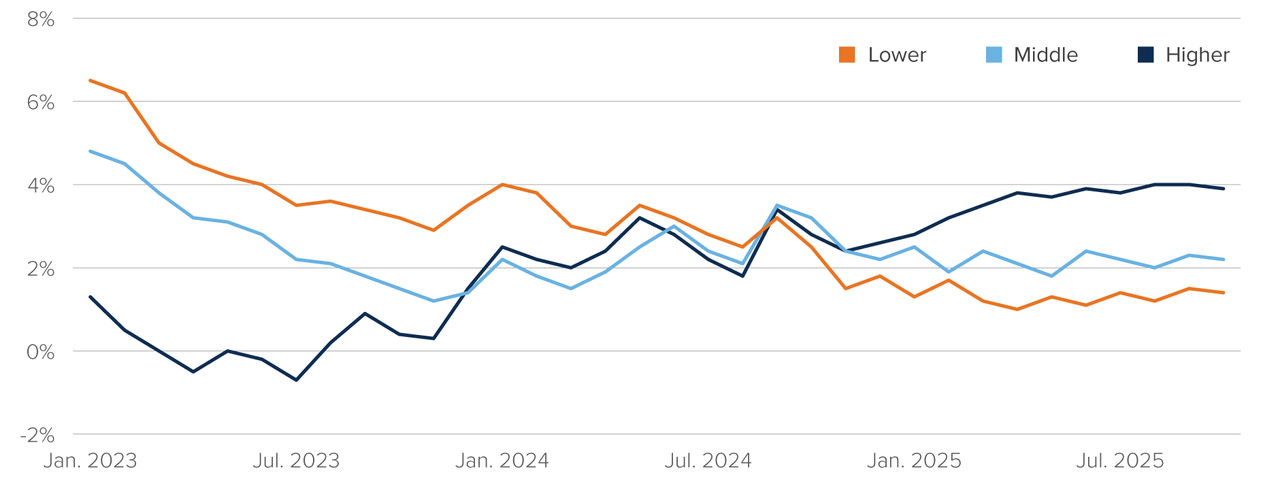
Figure 7
Source: Bank of America. After-tax wage and salary growth by household income terciles, based on Bank of America aggregated consumer deposit data (3-month moving average, YoY%, SA)
This chart highlights how higher-income households, the “haves”, have benefited significantly over the past year, supported by strong wage growth.
The charts presented aim to bring the divergence in economic outcomes across different segments of the population into sharper focus. They illustrate how robust spending by upper-income households has played a central role in sustaining economic momentum and helping the economy avoid a recession. The key question for the reader is how long this dynamic can continue.
Conclusion
One of the defining characteristics of modern America is division. Political polarization has intensified, with entrenched ideological camps on both the left and the right. Demographic divides have widened as aging baby boomers and younger generations face vastly different economic realities. Even cultural fault lines have become more pronounced, reflecting deep underlying tensions.
Yet among these divisions, the gap between the “haves” and the "have-nots” may be the most economically consequential. Income and wealth concentration in the US is now more extreme than at any point in recent history, and the trend continues to move in that direction.
Ironically, this widening gap has helped sustain economic growth in the short term. Strong spending by wealthy households, who account for a disproportionate share of total consumption, has been a key factor in the US economy’s ability to avoid recession despite tighter monetary policy, higher tariffs and repeated growth headwinds.
The durability of this dynamic, however, is far from assured. An economy increasingly reliant on the spending power of a narrow segment of households may prove resilient in the near term but is also becoming more fragile over time. If asset prices falter or confidence among upper-income consumers weakens, the broader economy may have fewer buffers than headline growth figures suggest.
The“K-shaped economy” may explain recent strength, but it also highlights a fundamental imbalance, one that carries meaningful economic, political and social implications for years to come.
Multi-Asset Strategies Team’s investment views
Tactical summary
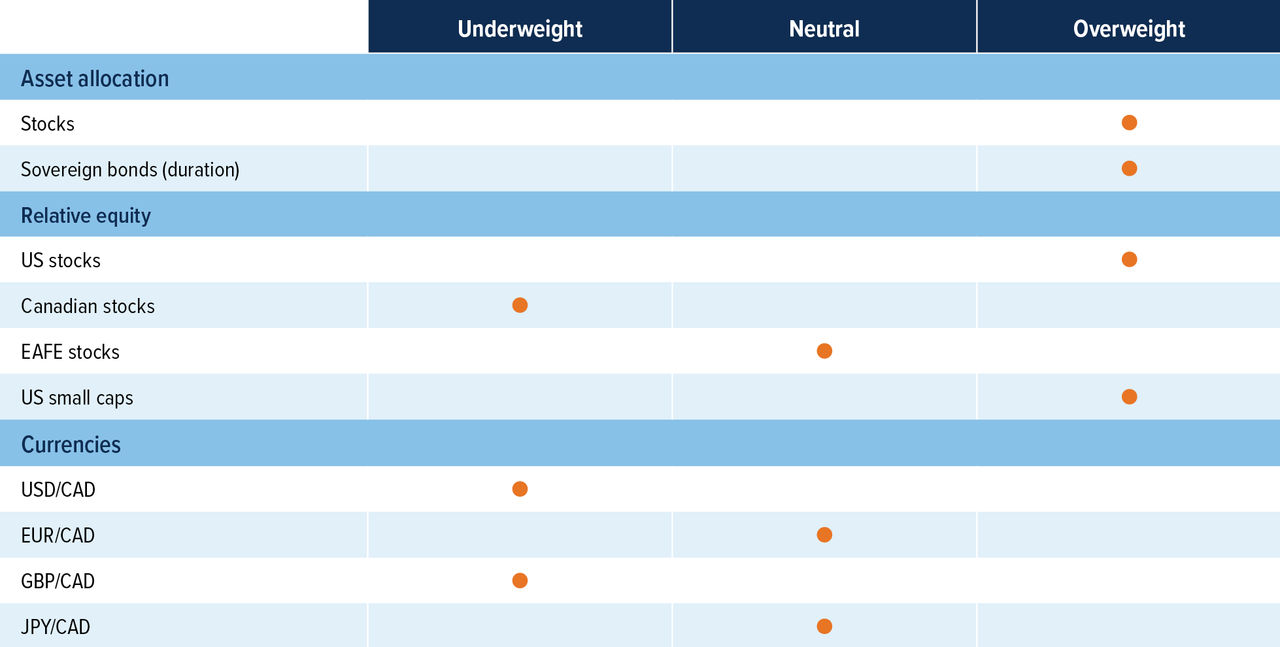
Source: Mackenzie Investments.
Note: The opinions expressed in this piece reflect short-term tactical views, which inform the positioning of some of the funds managed by the Multi-Asset Strategies Team.
Positioning highlights
Going back to overweight duration: President Donald Trump nominated Kevin Warsh, a former Federal Reserve governor, to serve as the next Fed chair, replacing Jerome Powell when his term ends in May. Historically, Warsh has been known as a monetary hawk which goes against Trump’s goal of lowering interesting rates. Warsh also wants to reduce the Fed’s balance sheet which would involve selling treasuries. As a result, yields have increased to an attractive level for us to go back to overweight duration.
Allure of stocks remains: Earnings season in the US is in full swing, and companies are beating expectations at levels similar to historical averages. Mega‑cap earnings have been mixed: Microsoft saw the second‑largest single‑day market‑cap decline in S&P 500 history after its earnings miss, while Meta outperformed. On a positive note, stock‑market breadth has improved, with non‑Magnificent 7 names outperforming, which we view as a positive signal for holding equities. Even with bond yields rising, equities have remained resilient, further showing the strength of equity markets.
Buy US vs. Canada equities: The TSX has outperformed the S&P 500 last year due to financials and a large weight to materials while all other sectors underperformed. As a result, the TSX doesn’t look as attractive from a valuation perspective. Meanwhile, in the US, the breadth of stock outperformance has increased recently. US economic data is also coming in stronger than Canada’s which should be supportive for US equities over Canada.
Currencies: USD remains overvalued and our long-term view is that it will depreciate against most developed market-currencies. We continue to favour the Japanese yen as the best play for this view. The UK economy continues to remain stagnant compared to others, so we prefer to maintain an underweight position in the pound.