
Highlights
- The second year in the US presidential cycle is typically the most volatile year for US equities.
- The period following any downside volatility in the second year of the US presidential cycle typically ushers in a phase of predictably strong returns for US equities.
- Expect particularly high volatility as we move closer to the US mid-term elections in November; based on his near-historic negative approval rating, at this stage it appears that Trump is on course to lose control of the US House of Representatives.
Recap
The economy: in 2025, the global economy expanded modestly but below long-term averages, as growth remained subdued amid trade tensions, elevated debt and policy uncertainty. Global GDP is projected around 2.7-3.3%, with inflation gradually declining but still above pre-pandemic norms. Geopolitical frictions and tariff escalations disrupted supply chains and weighed on investment and trade patterns. Growth was uneven: emerging markets and some developing regions outpaced many advanced economies, while the overall expansion stayed fragile.
In North America, the US economy showed resilient output but faced labour market softening, weaker hiring and policy-driven volatility. Tariffs and fiscal decisions slowed job growth, and the dollar weakened significantly against major currencies. Corporate stress increased, with rising bankruptcies in some sectors. Canada and Mexico saw slower but steady growth, influenced by regional trade dynamics and external demand.
Overall, 2025 was marked by slower global growth, persistent structural challenges and significant regional divergence, with North America grappling with policy uncertainty and labour pressures.
Capital markets: in 2025, global capital markets delivered strong overall performances, driven by robust equity gains and heightened investor activity. Major stock indices, including the MSCI World and S&P 500, posted double-digit annual returns (~20%+ globally and ~18% in the US), underpinned by AI-led growth and solid corporate earnings, despite volatility from trade policy shifts and high valuations. Precious metals like gold and silver surged sharply and attracted inflows, while traditional safe havens lagged. Bond markets saw mixed flows, with some outflows in parts of the fixed-income space.
In North America, US equities outperformed, with significant gains in tech and broader indices, though markets were volatile near year-end. Equity fund inflows were strong, and investors responded to expectations of rate cuts. Canadian equities also realized solid returns, supported by resilient sectors like gold, financials and energy. Overall, 2025 was a year of broad equity strength, sector rotation and active capital deployment amid evolving macroeconomic conditions.
The new year
Welcome to the new year.
We remind readers that one defining feature of 2026 is that this is the second year in the US presidential cycle. Historically, US equity market returns have followed a trend through the four years of each presidential term. The first and fourth years usually have the strongest equity market returns; the second year is the weakest year for total returns and is typically a period of the most significant volatility.
As well, in November of this year, the Trump administration will receive direct feedback from US voters on the extent to which Americans are feeling good about the direction the nation is heading in. How have these political events affected US equity markets in the past? Are there repeatable patterns that investors need to be aware of?
As always, read on.
Past presidential cycles: the empirical data
The relationships that are highlighted below might be probabilistic, not causal, and their reliability may have diminished over time, particularly in the presence of macro shocks or policy-driven markets. Nonetheless, it’s important for investors to be aware of some of the patterns that have existed in the past. They may want to understand why such patterns existed, to see the extent to which current conditions might be similar.
Figure 1 shows quarterly average returns for the S&P 500 through the four years in the US presidential cycle over the past 63 years.
Quarterly average S&P 500 price returns by presidential cycle (1961-2024)
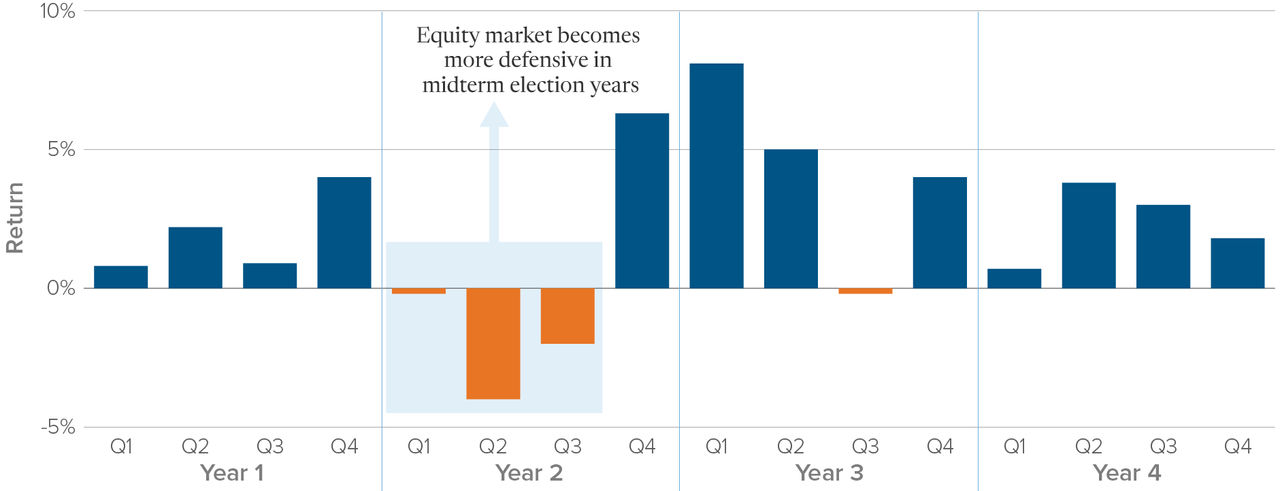
Source: Strategas Research
This chart demonstrates that the four years in the US presidential cycle play out in a predictable manner. Here is an explanation of what typically happens:
- Year one: the honeymoon:
- It takes time for the incoming president to appoint new members of the administration, to solidify the policy agenda and to pass legislation to begin the implementation process.
- A period of euphoria ensues; there is no “baggage” for the incoming administration to have to justify, and equity markets rally.
- Year two: the heavy lifting:
- Voters and investors are impatient for action.
- The new administration makes the hard policy decisions that will define their term in office.
- Any “pain” associated with hard policy decisions happens in year two, rather than toward the end of term (when the focus is on getting re-elected).
- Year three: dividends pay off:
- If policy is coherent, the fruits of hard policy decisions begin to emerge.
- Year four: it’s time to get elected:
- No hard policy decisions are implemented; the focus is on governing in a manner that maximizes the potential to be re-elected for another term.
As a result of the above, year two is the most challenging part of the US presidential cycle for equity investors. Figure 2 exhibits an alternative way to see the challenges associated with year two in the presidential cycle. Not only are returns weak, but volatility (both downside and upside) is greatest in year two. The chart below demonstrates that year two is the period with the greatest volatility (see figure 2 below).
S&P 500 corrections and one-year following correction
performance by presidential cycle (1960-2024)
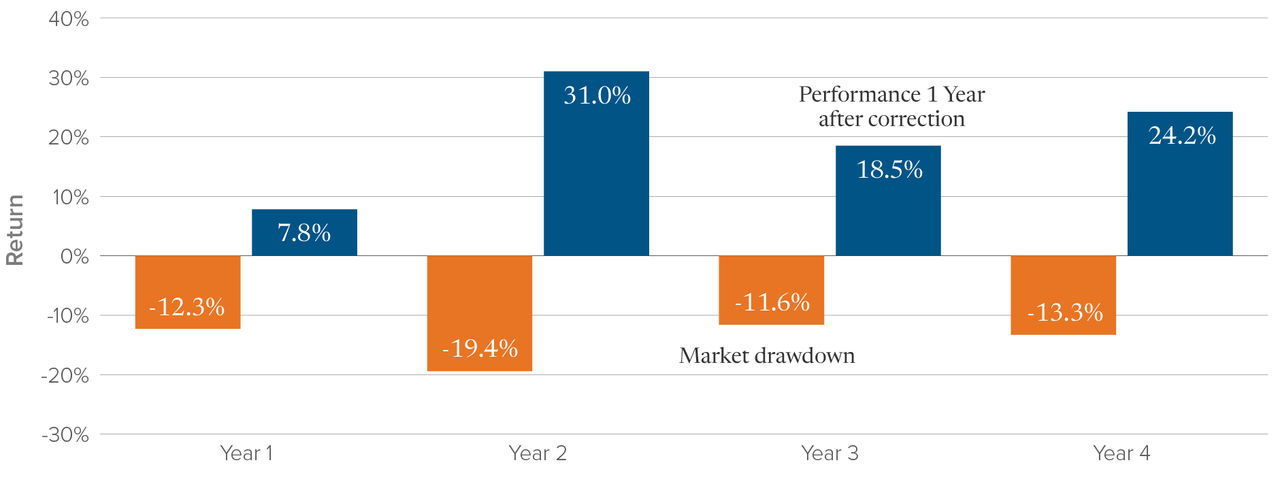
Source: Strategas Research
This chart demonstrates that the average drawdown in year two is -19.4%, while the subsequent snap back is 31%, both the largest readings through the presidential cycle.
On a related but slightly tangential note, what is to be expected once the mid-term elections are behind us? As was shown in figures 1 and 2, year two in the US presidential cycle has historically been the most challenging for investors. However, the following chart demonstrates that returns for investors in US equities have been predictably strong in the year following mid-term elections (see figure 3 below).
S&P 500 price return, 12-month period following mid-term election
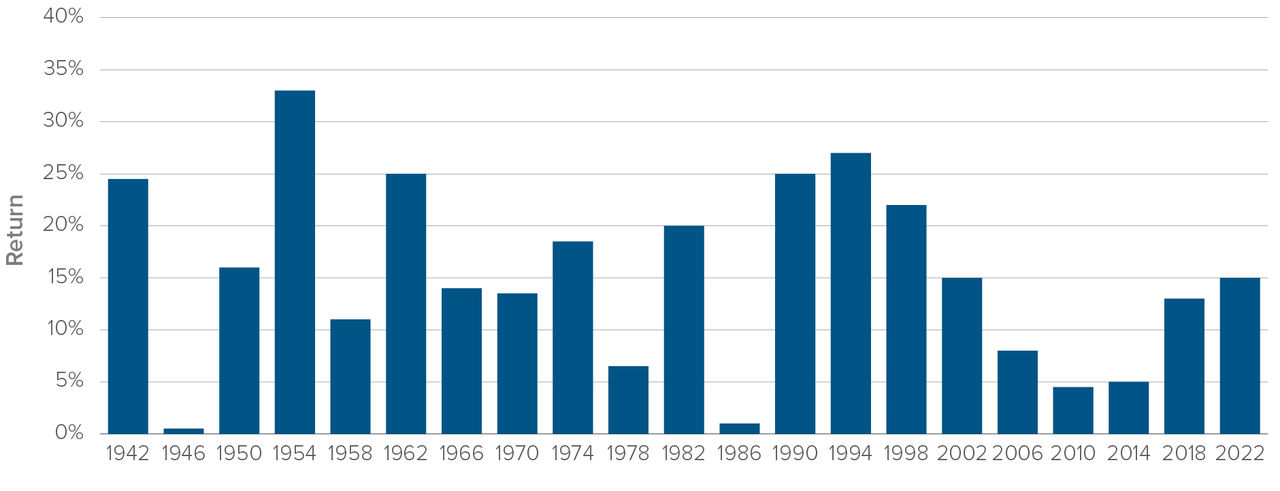
Source: Strategas Research
As per this chart, since 1938, returns for the S&P 500 have always been positive in the 12-month period following mid-term elections.
Therefore, there is the potential for strong equity returns going forward. The key then is to be aware that heightened intra-period volatility is to be expected and to use whatever downside emerges as an opportunity to leg capital into equity markets.
Mid-term elections: what to expect
With some degree of certainty, we can predict that President Trump is highly likely to lose his hold over power in Congress this fall. In fact, in nine of the last ten mid-term elections, the party in power lost one of the chambers of Congress in mid-term elections.
What is the logic behind that?
A mid-term election is a referendum on the performance of the new administration. Those that voted for the administration likely approve of the policy agenda. In Trump’s case, MAGA voters knew that the president was very much in favour of a very restrictive trade policy, in favour of aggressive immigration control and in favour of a vastly expanded role for the executive branch of government. Those that did not vote for the Trump administration have an axe to grind with many of these policies and they very well may use the mid-term elections as their opportunity to voice their displeasure. Many anti-MAGA voters (those on the “radical left”, centrists and independents) are angered at the direction President Trump has taken the country in, and it has energized them to protest via the ballot box. They will show up to vote in November, likely in greater numbers than MAGA supporters.
That is what has happened historically. The supporters of those not in power turn out to mid-term elections in disproportionate numbers to send the message to Washington that they aren’t happy.
The key to how President Trump fares in mid-term elections rests on his approval rating. Let’s look at how the presidential approval rating has translated into House seats lost in prior mid-term elections.
The chart below demonstrates that there is a strong historical relationship between the president’s approval rating heading into mid-term elections and seats lost in the House of Representatives (see figure 4 below).
Republican presidential approval rating and house seats gained/lost in first mid-term
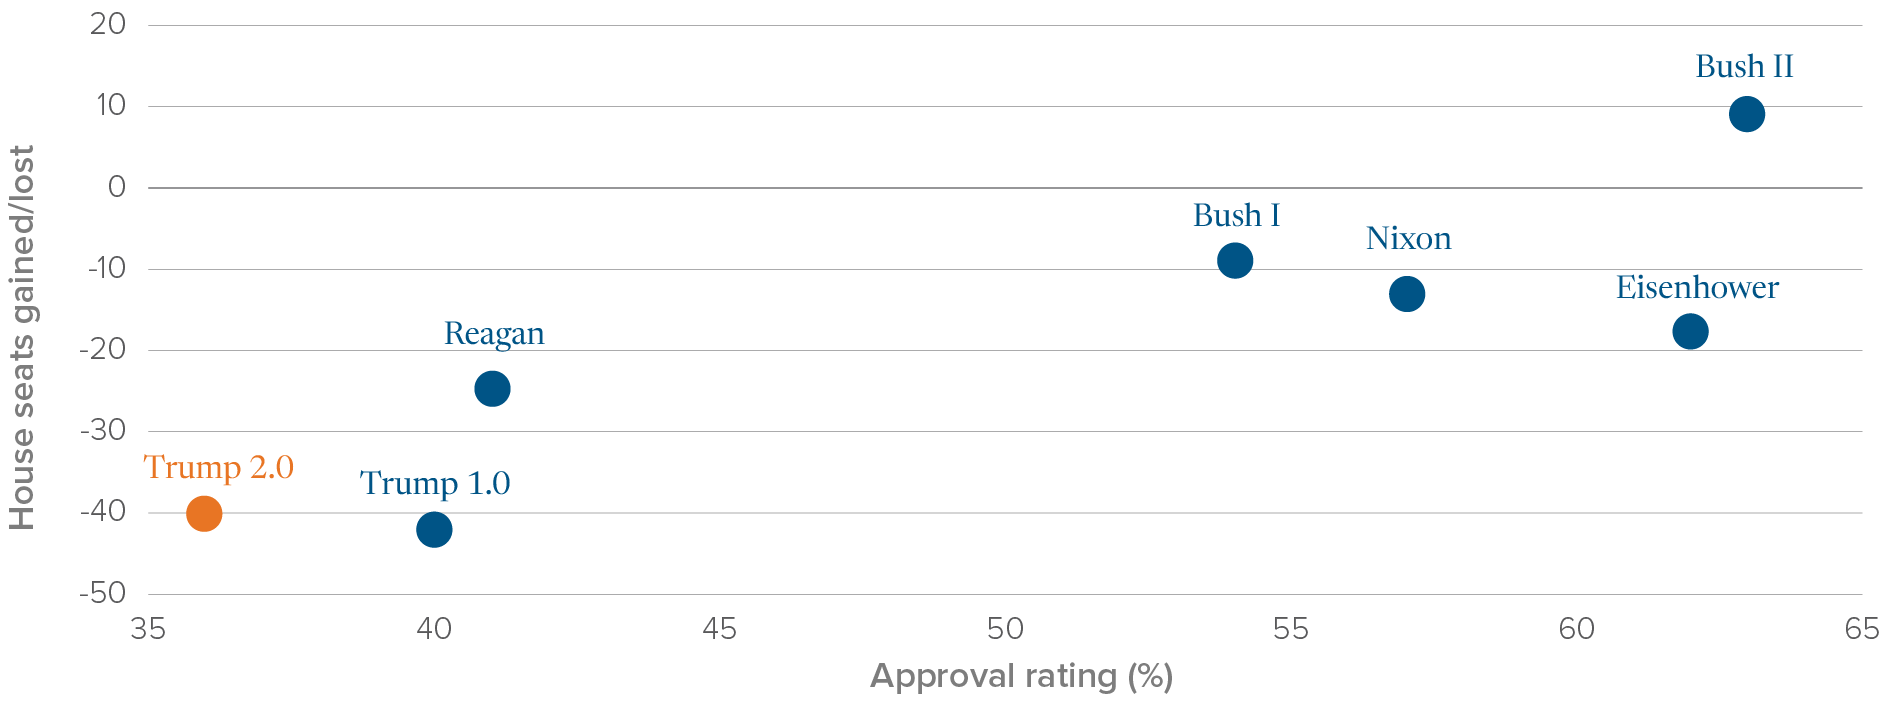
Source: Strategas Research
The intuition behind this is ominous for President Trump. As we neared the end of 2025, President Trump’s approval rating was near the lowest ever recorded for a sitting president at the end of the first year of a term. President Trump’s approval rating is now at about 36% - 39%. For comparison purposes, here are the approximate approval ratings for former presidents at the end of the first year of their term:
- Barack Obama high 50s to 60%
- George W. Bush mid 50s to 60%
- Bill Clinton above 50%
- Ronald Reagan 49%
- John F. Kennedy mid 60s to 70%
The chart above demonstrates that Trump’s current disapproval rating would translate into a sizable loss of seats in the House of Representatives, like the loss recorded by the Republicans in the mid-term elections of 2018 (when the Democrats gained 41 seats).
Another alarming indicator for Trump is that the Democrats have done consistently well in congressional district special elections held since November 2024 (see figure 5 below).
Margin swings in 2025 congressional district special elections from November 2024
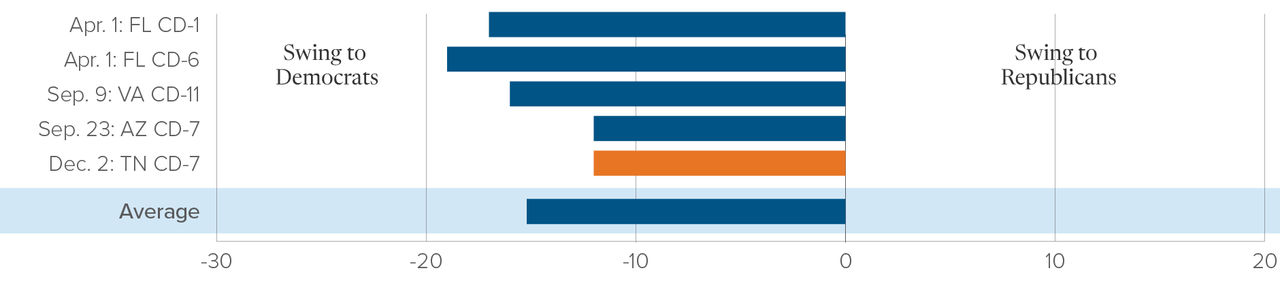
Source: Strategas Research
This chart demonstrates that the Democrats have benefited from a 15% swing in elections held since November 2024. These special elections have taken place due to congressmen and congresswomen resigning their seats (due to personal reasons, such as illness or death). That trend does not bode well for Trump in the mid-term elections. A mid-term election outcome that wrests control of Congress from Trump would be noteworthy for equity investors; thus far in Trump 2.0, Congress has been unwilling or unable to hold President Trump in check. That may change after the mid-term elections to be held this coming November.
Conclusion
Equity market returns, in the US and elsewhere, were stellar in 2025. But that was then, and this is now.
One of the factors that will influence equity market returns in 2026 is where we are in the US presidential cycle. As we have shown, year two of the presidential term has typically been the most volatile for equity markets. After such a strong run in global equity markets in 2025, it would be surprising if there were no sizable market check-backs as we progress through 2026. Note that this would be “normal” given previous analogues, and that forward returns from market lows would be strong (based on history).
There are many reasons to expect attractive returns in 2026, but there is the potential for greater volatility than we experienced in 2025. Make sure that you manage the risk profile of your portfolio in a manner that aligns with your constraints and objectives; expect the best, plan for the worst.
Multi-Asset Strategies Team’s investment views
Tactical summary
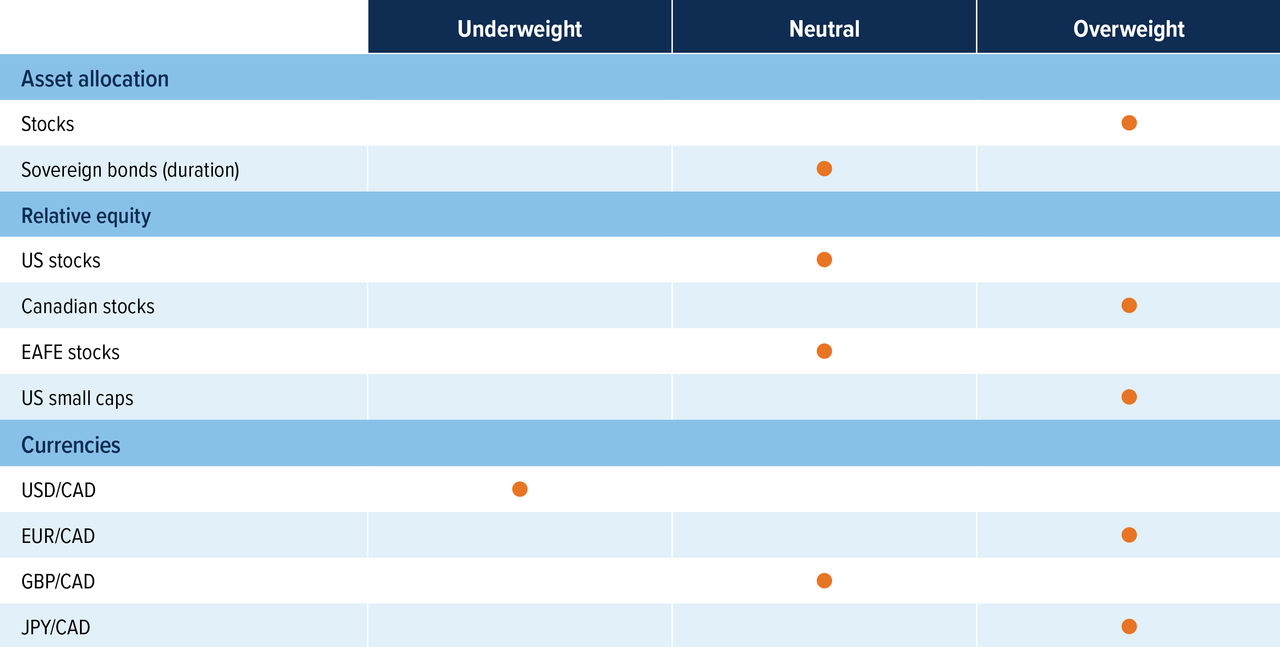
Source: Mackenzie Investments.
Note: The opinions expressed in this piece reflect short-term tactical views, which inform the positioning of some of the funds managed by the Multi-Asset Strategies Team.
Positioning highlights
Staying neutral on duration: the US Federal Reserve has continued to signal that inflation is above its target, despite the job market slowing down. There are at least two rate cuts currently priced in for 2026, which we think is a fair estimate, so there is no need to increase duration at the moment. At this point, we are waiting for the announcement on who the new Fed Chair will be to see if there will be any reactions.
Stocks’ allure returns: earnings season in the US has ended strongly, with Nvidia beating estimates. Despite the strong report, AI names have lagged as overvaluations concerns remain. However, non-AI names have continued to perform strongly, and we believe they will help lift the market overall going into 2026. Furthermore, Q3 GDP for the US came in at 4.3% versus a 3.3% estimate, which shows the economy remains solid, which should be a good backdrop for stocks.
Are we increasing our positioning in the international space? Our view on US/Canada versus international equities is more nuanced than usual. Tactically, we've recently shifted to a neutral stance on US equities (from an underweight) and we have not made any broad-based increases in international exposure. However, we’ve made selective regional adjustments to our positioning. For example, we’ve reallocated some exposure from Europe to Canada. That said, we continue to see strong valuation support in Japan, and from a long-term perspective, EAFE and emerging markets remain more attractive than the US or Canada on a pure value basis.
Buy Canadian? Canadian economic data has continued to show resilience recently, with 53,600 jobs created in November relative to expectations of -2,500, showing that the economy is not collapsing, but the case for rate cuts is still on the table, which is an environment that should be supportive for domestic equities. At the same time, strength in financials and gold has led to upward revisions in Canadian earnings forecasts, providing an additional tailwind for the broader market.
Currencies: the US dollar remains overvalued, and our long-term view is for the US dollar to depreciate versus most developed countries. We also continue to like the euro and Japanese yen as the best plays for this view. The euro has benefited the most from a weak US dollar, while Japan screens the cheapest of the G5 currencies.