
Highlights
- The US Federal Reserve Board may be in the early stages of a rate cutting cycle.
- In general, a rate cutting cycle has been a bullish environment for equity returns.
- Investors must determine the underlying rationale for cutting rates; a rate cutting cycle in a recessionary environment has historically not been a positive environment for equity returns
The US Federal Reserve is widely expected to move its benchmark interest rate, the Fed funds rate, lower over the course of the latter half of 2025 and through the end of 2026. In fact, current market expectations are for the Fed funds rate to close 2025 at about 3.6% and 2026 at 3.4%, implying cuts of +100 bps by year end 2026 from September 2025.
While the Fed will be “data dependent” and the actual trajectory of the Fed funds rate may differ, let’s assume for now that a meaningful (+100 bps) cut in administered interest rates will occur between September 2025 and the end of 2026. Given past precedent, what should we expect of equity returns (using the S&P 500 benchmark as our bogey)?
Context:
The US Federal funds rate (Fed funds) is the interest rate at which banks and credit unions lend reserve balances to other depository institutions overnight. It is set by the Federal Reserve (the Fed) as part of its monetary policy toolkit. It is not directly set by the market. Instead, the Fed establishes a target range and uses tools like open-market operations to keep the actual rate within that range.
Why the Fed funds rate matters to investors:
- Influences all other interest rates: the Fed funds rate affects all sorts of lending rates, including mortgage, credit card and business loan rates. When it rises, the cost of borrowing increases.
- Signals economic policy direction: a rate hike typically signals that the Fed is trying to cool inflation or an overheating economy.
- Effects on asset prices:
a. Equities – lower rates generally boost stock valuations by making future earnings more valuable and borrowing cheaper.
b. Bonds – rising yields generally reduce existing bond prices, as newer issues offer higher yields.
c. Currencies – higher rates can strengthen the US dollar by attracting foreign capital, and vice versa.
In short, the Fed funds rate is a cornerstone of US and global financial markets — influencing liquidity, asset prices and investor behaviour worldwide.
But what is the appropriate level of the Fed funds rate and what impact will a cycle of rate cuts have on equities? The balance of this paper examines history to provide some insight into how changes in the Fed funds rate may play out over the upcoming 12 to 18 months.
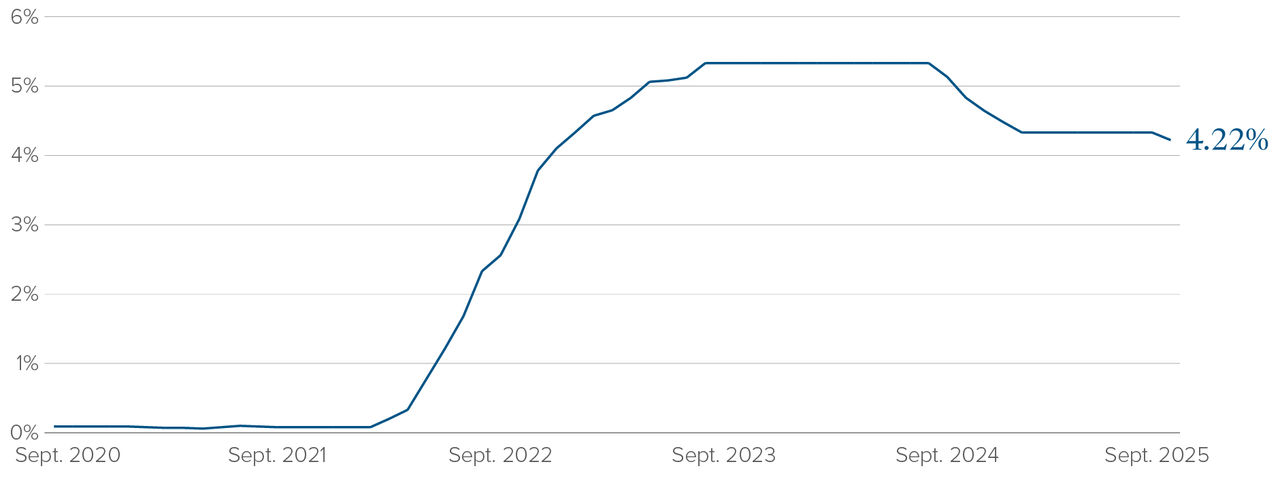
The Fed funds rate is at an elevated level, reflecting the rise in interest rates coming out of the COVID-19 pandemic. In 2021 and early in 2022, inflation rose dramatically and central banks around the world responded by raising administered interest rates sharply. The Fed took the Fed funds rate from a generational low range of 0.00–0.25% in 2022 to 5.25–5.50% in 2023. See Figure 1 for the recent history of the Fed funds rate.
Federal funds effective rate
 Source: Federal Reserve
Coming into 2025, Fed Chairman Jay Powell had indicated a desire to move the Fed funds rate lower, based on the view that the level at that time was inconsistent with the near and intermediate term trajectory of inflation. Those plans were shelved when the incoming Trump administration indicated a policy in Q1 to dramatically increase tariffs on goods imported into the US, a move that Fed Chair Powell expected could lead to rising short-term inflation expectations. Powell paused on rate cuts through the spring and summer, hesitant to cut rates until the full story was written on the extent to which tariffs were inflationary, if at all. By September Powell was comfortable enough with the data that he was seeing to initiate the first of what many expect will be a series of 25 bps rate cuts.
For expectations on the pace at which the Fed may move the Fed funds rate lower, see Figure 2. This chart shows the expectations of Federal Reserve members at the pace of rate easing over the intermediate term (this is shown in a “dot-plot” chart).
FOMC dot plot: September 2025
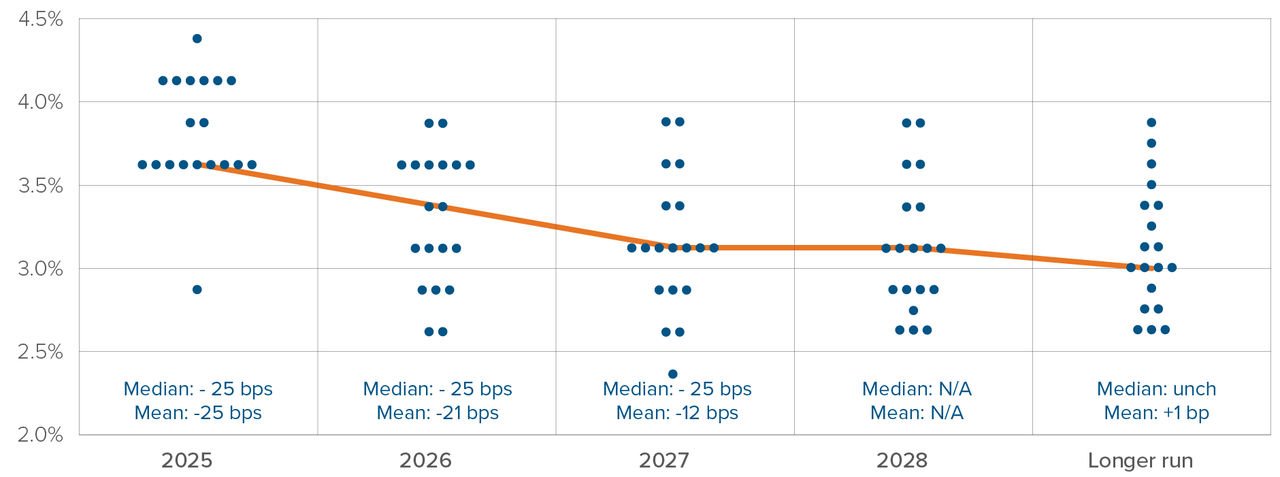 Source: NBC, Federal Reserve Bank.
From the dot-plot we can see that Fed members expect a series of rate cuts by year end 2025 and through 2026.
How far might the Fed go in cutting rates?
It depends.
There are many theories on how far the Fed may go in cutting rates in the current cycle. One important aspect of the debate is on where the non-inflationary or equilibrium Fed funds rate is, or, as economists refer to it the “R*” interest rate. While R* is a theoretical concept, it might be useful to review historic data to see what trends there have been on where the Fed funds rate may land.
Figure 3 shows the history of the real Fed funds rate over a long period of time. The real Fed funds rate is the current nominal rate less inflation. For instance, the current real Fed funds rate is nominal Fed funds rate, minus inflation, or 4.11% - 3.00% = 1.11%.
Real Long Rates — Ten-Year U.S. Treasury Bonds Yields
Less 10-Year Inflation Expectations1
1982 Through Late- September 2025
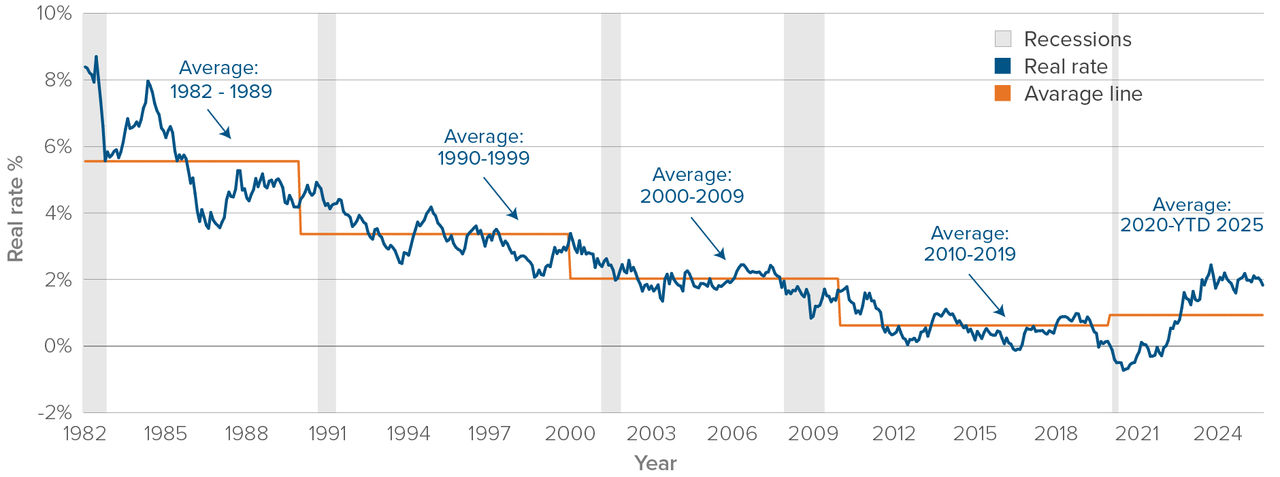
Source: Federal Reserve Bank of Cleveland, Federal Reserve Board, National Bureau of Economic Research, Empirical Research Partners Analysis.
¹Less the trailing three-month average of ten-year inflation expectations as estimated by the Cleveland Fed model.
As can be seen from the above chart, the real Fed funds rate is not static; it tends to trade in a particular range for an extended period. It is interesting that the real Fed funds rate was in a +150 – 250 bps range for the better part of a decade prior to the Great Financial Crisis, whereas it was in a +0 – 100 bps range for the subsequent decade through to the onset of COVID-19. That period has been referred to by some as a period of “financial repression” — a period where central banks kept interest rate policy and overall financial conditions especially loose.
What is the appropriate target for the Feds funds rate in the present day and for the intermediate time horizon? Will the real Fed funds rate look more like the period prior to or post the Great Financial Crisis?
We won’t attempt to answer that question. Instead, while we could look at market-based estimates, let’s suffice it to say that we assume that the Fed will be successful in implementing a series of rate cuts of some significance through to the end of 2026. Perhaps that might result in (including rate cuts commencing in September 2025) a total of 100 – 150 bps of easing. The balance of this paper looks at the potential impact to equities of upcoming Fed rate cuts.
How might equities perform in a rate cutting cycle?
On this subject, we have a lot of empirical data.
See Figure 4 for a history of how the S&P 500 Index has performed through a variety of Fed funds rate regimes.
Avg. Monthly S&P 500 Return in Different Fed Funds Rate Regimes
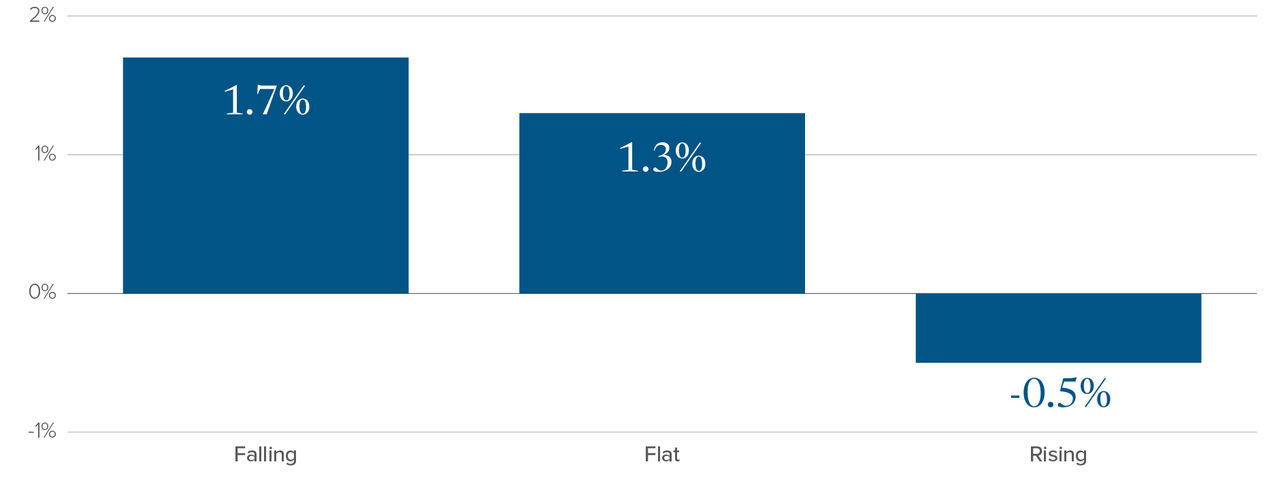
LS: FactSet, Bloomberg, Morgan Stanley Research. 12M rate of change on fed funds rate is negative.
RS: Bloomberg, FactSet, Morgan Stanley Research.
Now let’s focus on cycles involving cuts to the Fed funds rate. See Figure 5 for a history of how the S&P 500 has performed through past Fed rate cut cycles.
S&P Performance 1 Year Following First Cut of Cycle
Data Since 1974
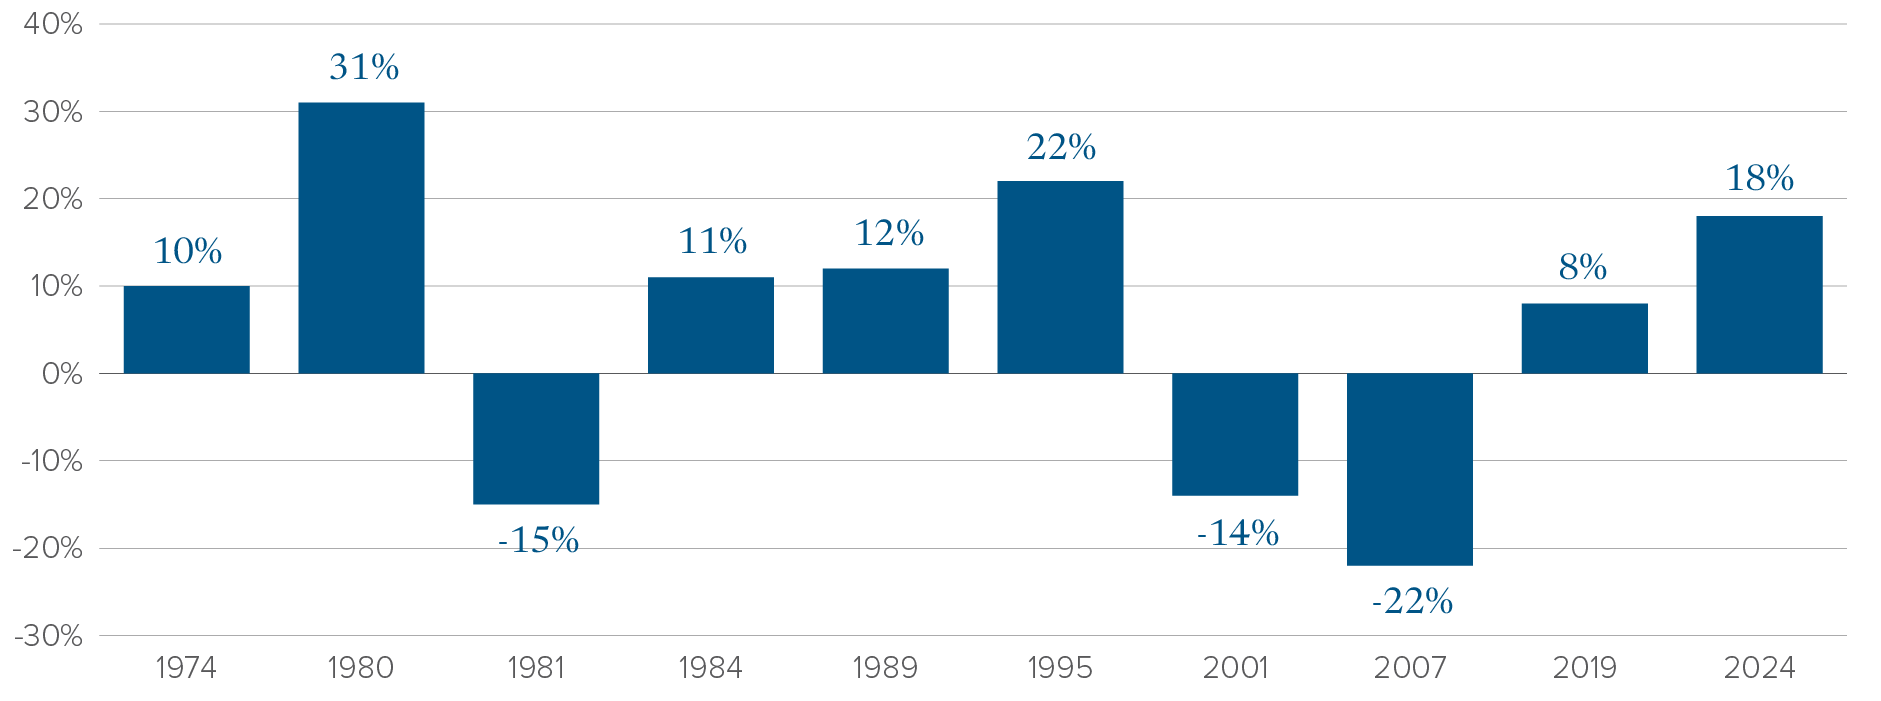 Source: Strategas, Bloomberg, data as of September 18, 2025.
This chart shows that equity markets generally rallied in the 1-year period post the first rate cut.
But what about the current environment, where the Fed is resuming rate cuts after a long pause (the Fed having cut rates in September, November and December of 2024)? How have equity markets typically performed in the 1-year period post a rate cut after a long pause in cutting rates? See Figure 6 for the history of this situation.
S&P 500 Performance 12 Months Following the First Rate Cut After a 6+ Month Pause
Data Since 1974
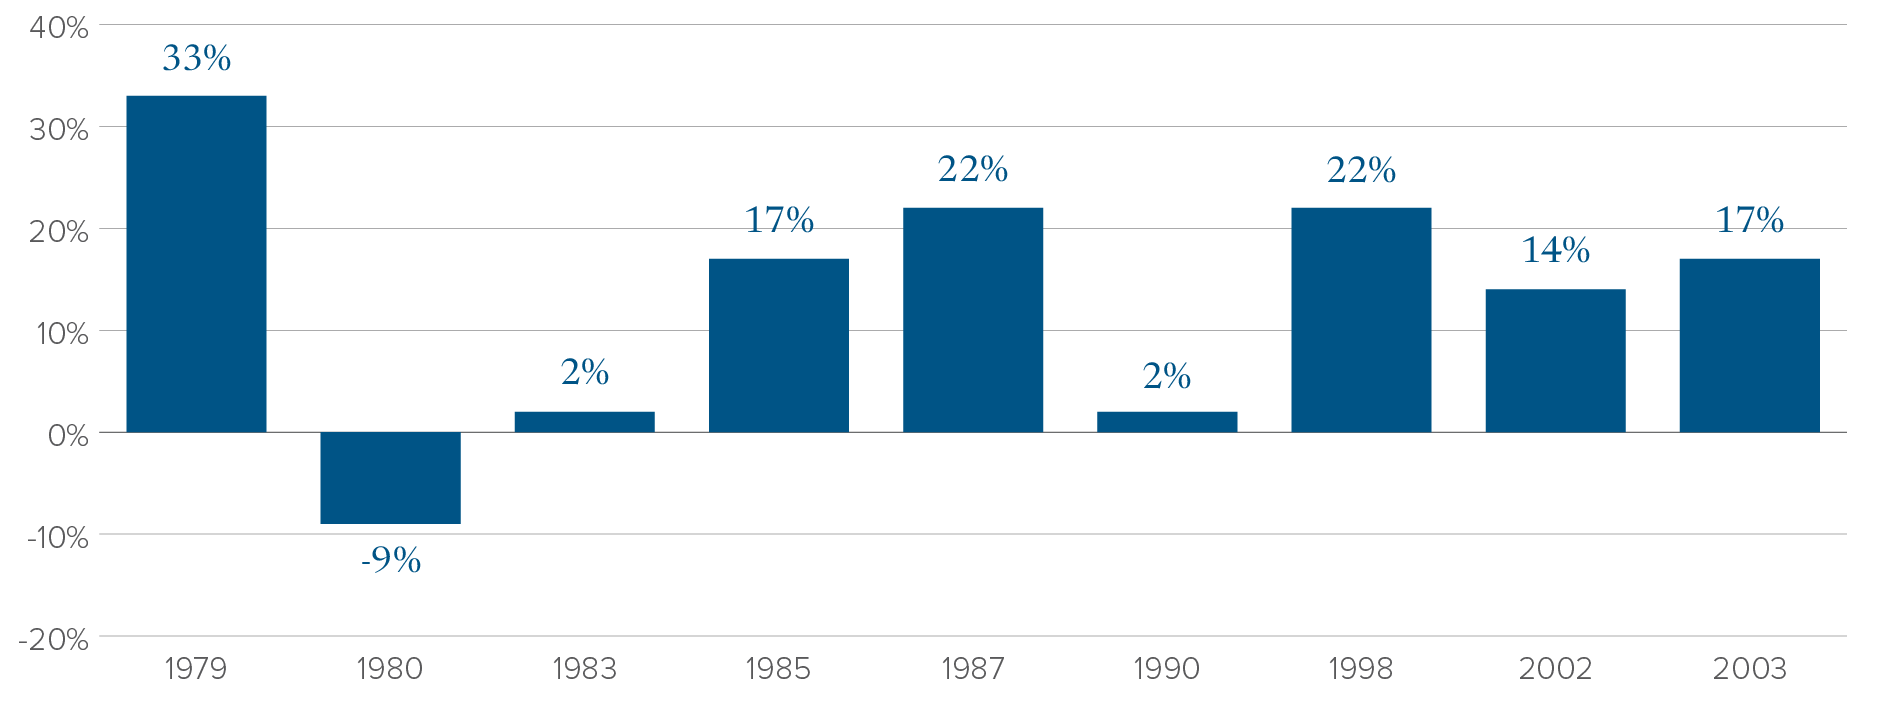 Source: Strategas, Bloomberg, data as of September 18, 2025.
It is important to stop at this juncture to make an observation based on the data presented thus far. It seems evident that, in general, there is a positive reaction by equities to cuts in the Fed funds rate. But the reaction in equity markets is not universal. While in most periods, equities rally as rates fall, there are some periods in which equities fall when rates fall. What is the logic involved during those periods?
The answer to that is critical to understanding how things might play out this cycle.
The commonality of those periods where equities fell coincident with declining interest rates is that the economy was either in a recession or heading into one, while the Fed was either in the midst of a rate-cutting cycle or just beginning one. We can summarize this into one of two potential scenarios:
Scenario one: interest rates are moving lower and there is no recession:
- The Fed can ease interest rates lower because inflation expectations are well contained.
- At the same time, the prevailing level of interest rates is higher than would be warranted given broad economic conditions (conditions may be somewhat weak, as evidenced by soft labour market data, but not recessionary).
- This is positive environment for equites.
Scenario two: interest rates are moving lower and there is a recession:
- Broad economic conditions are deteriorating, potentially markedly, and lower interest rates are required to spur demand.
- This is a negative environment for equities.
As is evident in Figure 5, there were, in fact, three periods where stocks fell while the Fed was in the process of cutting interest rates. Each of those periods involved an economic recession. Let’s look at what precipitated recession in each of those three periods:
1981:
- Recession occurred between July 1981 and November 1982.
- Was part of a “double dip” recession that occurred in 1980.
- The Federal Reserve, led by Paul Volcker, sharply raised interest rates to combat the high inflation of the 1970s.
- These high rates led to reduced borrowing, a collapse in construction and manufacturing and high unemployment (which peaked above 10%).
2001:
- Recession occurred between March and November 2001.
- The bursting of the dot-com bubble caused heavy losses in tech and stock markets generally.
- A decline in business investment and corporate profits occurred.
- The September 11 terrorist attacks further weakened confidence and spending.
2007:
- Recession occurred between December 2007 and June 2009.
- Economic conditions were deteriorating throughout the year due to the bursting of the housing bubble and rising defaults on subprime mortgages.
The three periods noted above, each of which involve a Fed funds rate cutting cycle, differ from the current environment in that they involved a recession. In the current environment, we believe that the likelihood of recession is fairly low and that, if history is any indicator, and all things being equal, the current rate cutting cycle should be a tailwind for equity investors over time.
Conclusion:
“Don’t fight the Fed”. That is one of the most well-worn directives heard across Wall Street over the years. The Fed has tools to affect the business cycle and thereby affect equity markets. Investors benefit from being aware of, and being positioned for, the direction of Fed policy.
Fortunately, it seems apparent at this juncture that the US economy remains on relatively firm footing. The likelihood of a near-term recession may be low, partly due to the fiscal policy stimulus associated with the One Big Beautiful Bill Act. Consumer and corporate demand levels remain healthy, and with upcoming stimulus there is some potential to further improve.
The interaction of the Fed’s move to a less restrictive monetary policy stance, coupled with ongoing economic expansion, may be a positive environment for equity markets over the intermediate term.
Multi-Asset Strategies Team’s investment views
Tactical summary
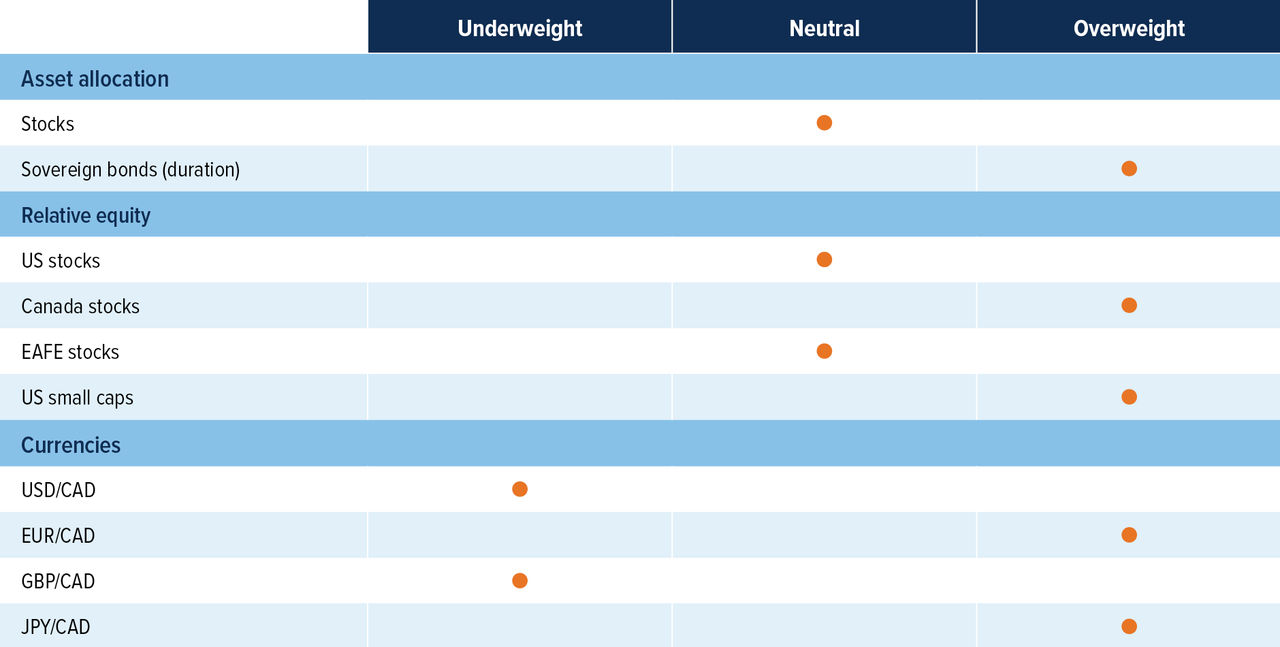
Source: Mackenzie Investments.
Note: The opinions expressed in this piece reflect short-term tactical views, which inform the positioning of some of the funds managed by the Multi-Asset Strategies Team.
Positioning highlights
Long on duration: US economic growth appears to be slowing, and we have seen data showing positive sentiment and flows into US bonds. Although still higher than their target inflation rate, the Fed appears to be prioritizing the slowing job market over inflation, which also aligns with Trump’s preference and most likely that of his future nominee for Federal Reserve Chairman.
Stocks’ allure wanes: Earnings season in the US has started strong, especially for the big banks. However, our underlying measures of the stock market shows that defensive names have begun to outperform cyclicals as investors are positioning more defensively. Earnings revisions are also turning negative which leads us to take a defensive stance in the short-term and close our overweight equity position.
Are we increasing our positioning in the international space? Our view on US/Canada vs. international equities is more nuanced than usual. Tactically, we've recently shifted to a neutral stance on US equities (from an underweight), and we have not made any broad-based increases in international exposure. However, we’ve made selective regional adjustments to our positioning. For example, we’ve reallocated some exposure from Europe to Canada. That said, we continue to see strong valuation support in Japan, and from a long-term perspective, EAFE and emerging markets remain more attractive than the US or Canada on a pure value basis.
Buy Canada? Canadian economic data has strengthened recently with 60,400 jobs created in September relative to expectations of 5,000, showing that the economy is not collapsing but the case for rate cuts is still on the table, which is an environment that should be supportive for domestic equities. At the same time, strength in financials and gold has led to upward revisions in Canadian earnings forecasts, providing an additional tailwind for the broader market.
Currencies: The UK economy has continued to slow, with CPI growth coming below expectations (0.0% MoM vs. expectations of 0.1% MoM). Combined with other data points, economic estimates have continued to be revised down so we continue preferring CAD over GBP. USD also remains overvalued, and our long-term view is for the USD to depreciate versus most developed countries.