The ETF Lab
ETF spotlight: Active ETFs: Unlocking opportunities for investors
Organic growth driven by evolving investor needs
Since its inception in the 1990s, the ETF industry has evolved dramatically, expanding from just a handful of ETFs to over 1,900 in Canada and 15,000 globally. This explosive growth is now accelerating in a new direction as the industry moves beyond its passive indexing roots. The catalyst is the rising demand for active strategies, driven by investors' need for advanced tools to optimize portfolio construction and manage risk in ways that traditional cap-weighted ETFs cannot.
Active ETFs combine professional management with the flexibility and efficiency of the ETF structure. Advisors are increasingly using active ETFs to access specific factors like value or quality, manage volatility, customize income, and express more nuanced market views for goal-oriented portfolio construction.
How they help | |
Fully active ETFs | Offer the potential to generate alpha through expert security selection and nimble adjustments to navigate changing market conditions. |
Strategic beta & factor-based ETFs | Allow investors to tilt toward proven drivers of long-term performance and build more resilient portfolios by reducing market-cap concentration risk. |
Income-oriented strategies | Focus on delivering enhanced and customized income to meet specific investor goals. |
Alternative | Help reduce reliance on the overall market direction to generate uncorrelated returns. |
Thematic ETFs | Provide targeted exposure to high-growth potential areas not well represented in broad market indexes, enabling investors to express a specific view on the future and potentially capture outsized returns from innovation. |
Active ETFs accelerate market share gains across
Canada and the US
Canada
In Canada, non-index ETFs have doubled their market share over the past decade, rising from 16% to 32%. This growth has been driven primarily by increased adoption of covered call and asset allocation ETFs.
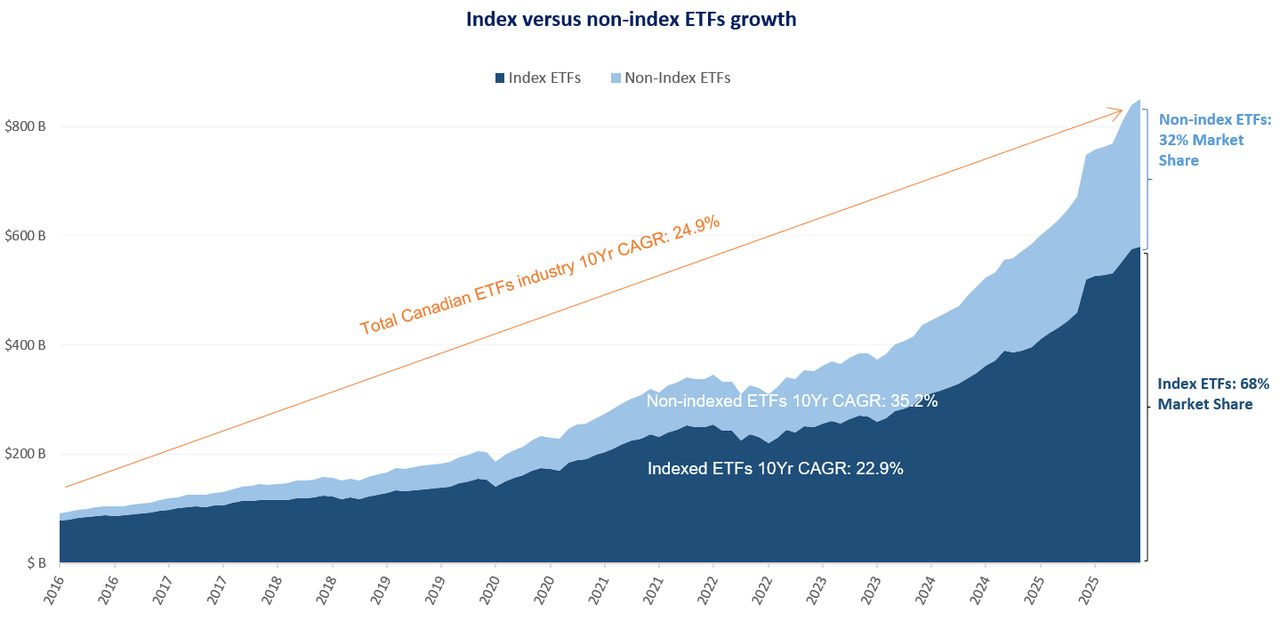 Source: Morningstar, as of February 28, 2026. AUM not adjusted for ETF of ETFs.
United States
In the US, active ETFs now represent roughly 51% of all ETFs, up from 20% in 2020. They captured about 33% of flows and 90% of new launches in 2025. With Vanguard’s ETF‑as‑share‑class mutual fund patent expiring, ETF wrapping is seeing rapid adoption among major issuers.
Shift toward active management among major US asset managers (AUM % in active ETFs):
Issuer | 2020 | 2021 | 2022 | 2023 | 2024 | 2025 |
BlackRock | 4% | 5% | 5% | 8% | 10% | 14% |
State Street | 9% | 9% | 10% | 10% | 21% | 28% |
Invesco | 7% | 9% | 10% | 10% | 21% | 28% |
Vanguard | 7% | 9% | 7% | 10% | 11% | 17% |
First Trust | 40% | 47% | 47% | 53% | 59% | 62% |
ProFunds | 1% | 1% | 1% | 3% | 3% | 6% |
JP Morgan Chase | 31% | 41% | 53% | 56% | 60% | 63% |
Van Eck | 4% | 8% | 12% | 12% | 7% | 11% |
Direxion | 0% | 0% | 12% | 17% | 28% | 42% |
Dimensional | 100% | 100% | 100% | 100% | 100% | 100% |
Source: Bloomberg intelligence.
Mackenzie’s expanding lineup of Active ETF solutions
For advisors looking to optimize portfolio construction, the Mackenzie ETF lineup offers an innovative and competitive suite of active solutions. Below are key ETFs designed to address a wide range of client objectives.
ETF name | Ticker | Mgmt. fee |
Core |
|
|
Mackenzie Cyclical Tilt ETF | MCYC | 0.55% |
Mackenzie Defensive Tilt ETF | MDEF | 0.55% |
Mackenzie Global Value ETF | MAGV | 0.80% |
Mackenzie GQE Global Equity ETF | MGQE | 0.80% |
Mackenzie GQE US Alpha Extension ETF | MALX | 1.15% |
Mackenzie GQE International Equity ETF | MIQE | 0.80% |
Mackenzie US All Cap Growth ETF | MAUG | 0.80% |
Mackenzie US Value ETF | MAUV | 0.80% |
Income and yield |
|
|
Mackenzie Canadian High Dividend Yield ETF | MHDC | 0.55% |
Mackenzie US High Dividend Yield ETF | MHDU | 0.55% |
Mackenzie Global Dividend ETF | MGDV | 0.80% |
Specialty |
|
|
Mackenzie GQE Canada Low Volatility ETF | MCLV | 0.45% |
Mackenzie GQE US Low Volatility ETF | MULV | 0.45% |
Mackenzie GQE World Low Volatility ETF | MWLV | 0.50% |
Mackenzie Bluewater Next Gen Growth ETF | MNXT | 0.80% |
ETF news & notes
Efforts to create a level playing field between Canadian and US-listed ETFs
Approximately 30% of ETFs held by Canadians are US-listed (Source: CETFA), a figure that may rise as upcoming US ETF share‑class launches expand access to strategies previously unavailable in mutual fund form. US-listed ETFs also benefit from structural advantages that may lead investors to view them as superior to Canadian equivalents. These advantages include the absence of sales tax on management fees in the US, greater tax efficiency related to capital gains management, and the ability to spread costs across large, established funds. Additionally, US products often have different fee disclosure standards and provide Canadians with reduced regulatory recourse.
To address these disparities, the Canadian ETF Association (CETFA) is working with the federal government and regulators to resolve structural and tax differences between Canadian and US-listed ETFs.
Key initiatives to level the playing field
- "Maple Investment" TFSA: CETFA is proposing a specialized Tax-Free Savings Account incentive designed to encourage Canadians to invest in domestically listed ETFs.
- Tax and fee reforms: The association is calling for the removal of sales tax (GST/HST) on ETF management fees to reduce costs for Canadian investors.
- Regulatory parity: CETFA is urging Canadian securities regulators to apply the same regulatory, disclosure, and, in some cases, sales rules to foreign-listed ETFs available in Canada as they do to domestic products.
- Addressing capital flight: With estimations that ~30% of Canadian ETF investments go to US-listed products, CETFA aims to stop the outflow of capital to the US market.
ETF flows update
The Canadian ETF market experienced a robust start to 2026, with $41 billion in total inflows over the first two months (YTD – As of February 28, 2026). The data reveals several key investor trends:
- Equity dominance: Equity ETFs attracted $26 billion, representing 65% of YTD flows.
- Strategic and factor‑based investing: Factor strategies - including Momentum, Value, and Multi‑factor - showed meaningful growth and strong asset increases.
- Dividend/Income demand: Yield‑focused ETFs captured $3.6 billion, or 11% of equity flows, reflecting continued investor appetite for income solutions.
- Geographic diversification: Following a trend that began in 2025, investors continued shifting assets toward broad developed and emerging markets to diversify beyond North America.
- Sector rotation: In Canada, flows revealed a rotation out of financials, even as all other sectors posted net inflows.
Top tips for trading ETFs in volatile markets
Periods of heightened market volatility can lead to wider ETF bid/ask spreads. To support better trade execution, consider the following best practices:
- Use limit orders to help balance execution speed with price control.
- Leverage trading support for larger or more complex orders. Advisors can connect with their Mackenzie wholesaling team, who will coordinate with regional ETF strategists to help facilitate trades.
- Monitor orders closely during volatile periods. Rapid price movements may mean a limit order that looked executable at entry becomes stale within seconds or minutes.
- Average into positions when volatility is elevated. This approach can reduce the impact of market timing by smoothing out the average purchase price.
For more ETF trading best practices, see our piece: ETF Trading Best Practices.
Mackenzie ETF top performers
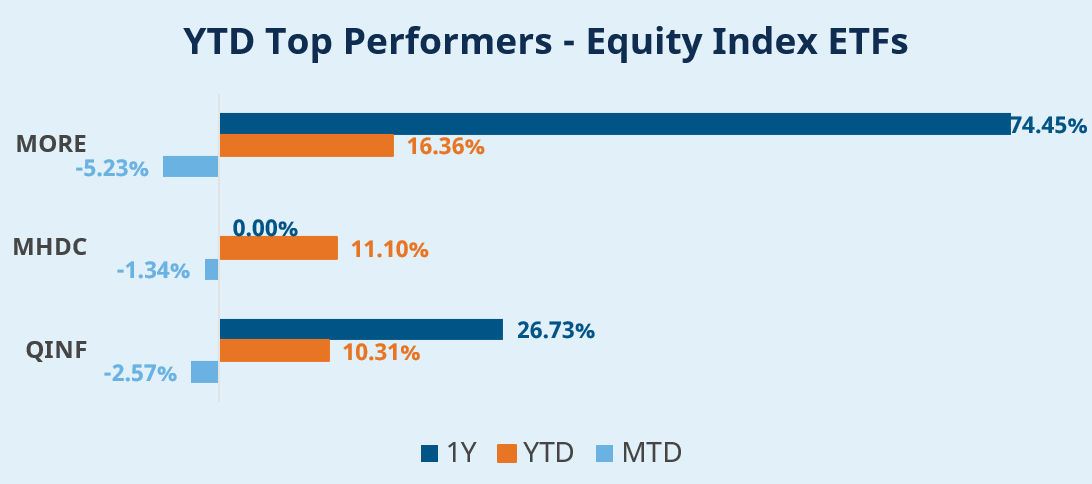
Equity ETFs
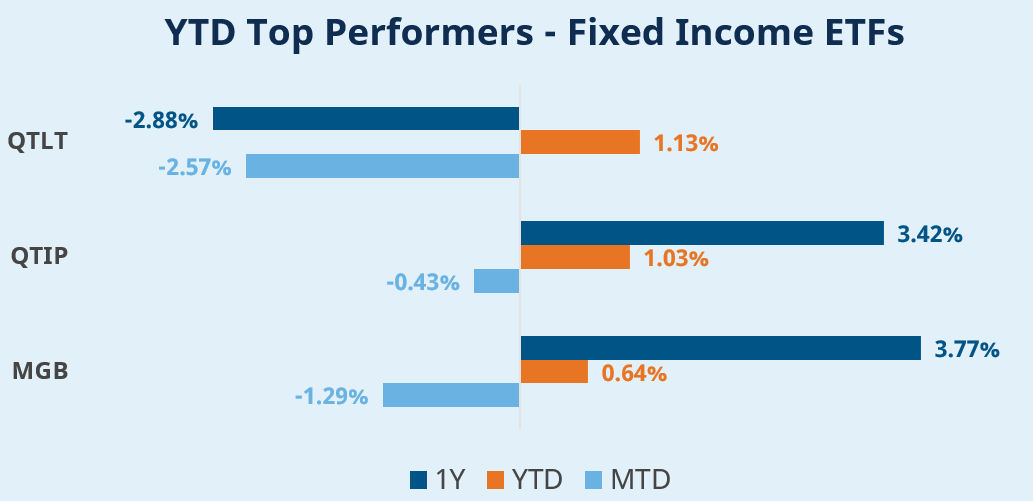
Fixed Income ETFs
 Source: Mackenzie investments, data as of March 6, 2026.
FOR ADVISOR USE ONLY. No portion of this communication may be reproduced or distributed to the public as it does not comply with investor sales communication rules. Mackenzie disclaims any responsibility for any advisor sharing this with investors.
Commissions, brokerage fees, management fees, and expenses all may be associated with Exchange Traded Funds. Please read the prospectus before investing. The indicated rates of return are the historical annual compounded total returns, including in share or unit value and reinvestment of distributions and does not take into account sales, redemption, distribution, or optional charges or income taxes payable by any securityholder that would have reduced returns. Exchange Traded Funds are not guaranteed, their values change frequently, and past performance may not be repeated.
The content of this article (including facts, views, opinions, recommendations, descriptions of or references to, products or securities) is not to be used or construed as investment advice, as an offer to sell or the solicitation of an offer to buy, or an endorsement, recommendation or sponsorship of any entity or security cited. Although we endeavour to ensure its accuracy and completeness, we assume no responsibility for any reliance upon it.
This should not be construed as legal, tax or accounting advice. This material has been prepared for information purposes only. The tax information provided in this document is general in nature and each client should consult with their own tax advisor, accountant and lawyer before pursuing any strategy described herein as each client’s individual circumstances are unique. We have endeavored to ensure the accuracy of the information provided at the time that it was written, however, should the information in this document be incorrect or incomplete or should the law or its interpretation change after the date of this document, the advice provided may be incorrect or inappropriate. There should be no expectation that the information will be updated, supplemented or revised whether as a result of new information, changing circumstances, future events or otherwise. We are not responsible for errors contained in this document or to anyone who relies on the information contained in this document. Please consult your own legal and tax advisor.
This article may contain forward-looking information which reflect our or third party current expectations or forecasts of future events. Forward-looking information is inherently subject to, among other things, risks, uncertainties and assumptions that could cause actual results to differ materially from those expressed herein. These risks, uncertainties and assumptions include, without limitation, general economic, political and market factors, interest and foreign exchange rates, the volatility of equity and capital markets, business competition, technological change, changes in government regulations, changes in tax laws, unexpected judicial or regulatory proceedings and catastrophic events. Please consider these and other factors carefully and not place undue reliance on forward-looking information. The forward-looking information contained herein is current only as of February 28, 2026. There should be no expectation that such information will in all circumstances be updated, supplemented, or revised whether as a result of new information, changing circumstances, future events or otherwise.
Index performance does not include the impact of fees, commissions, and expenses that would be payable by investors in the investment products that seek to track an index.
The Mackenzie ETFs are not sponsored, promoted, sold or supported in any other manner by Solactive nor does Solactive offer any express or implicit guarantee or assurance either with regard to the results of using the Indices, trademarks and/or the price of an Index at any time or in any other respect. The Solactive Indices are calculated and published by Solactive. Solactive uses its best efforts to ensure that the Indices are calculated correctly. Irrespective of its obligations towards the Mackenzie ETFs, Solactive has no obligation to point out errors in the Indices to third parties including but not limited to investors and/or financial intermediaries of the Mackenzie ETFs. Neither publication of the Solactive Indices by Solactive nor the licensing of the Indices or related trade mark(s) for the purpose of use in connection with the Mackenzie ETFs constitutes a recommendation by Solactive to invest capital in said Mackenzie ETFs nor does it in any way represent an assurance or opinion of Solactive with regard to any investment in these Mackenzie ETFs.