The ETF Lab
ETF spotlight: MHDC & MHDU: Income today, growth tomorrow
The strategy – A three-layer portfolio
- Equity portfolio selection: A portfolio of dividend companies is selected using a proprietary factor approach that combines a forward-looking analytical model with a factor optimizer.
- Call and put writing: Rules-based approach to write up to 30% of the portfolio out-of-the-money call and/or put options on individual securities or indexes.
- Leverage: A 20% cash leverage to enhance both yield and return potential.
The strategic objective behind the launch of MHDC and MHDU
- Meet the cash flow demand: A growing number of investors increasingly rely on their portfolios to generate consistent, reliable monthly distributions.
- Overcome income strategy pitfalls: Traditional dividend mandates often deliver insufficient yields or suffer from long-term underperformance. On the other hand, while conventional covered call strategies offer high immediate payouts, they frequently do so at the expense of long-term capital growth.
- Deliver a balanced solution: MHDC and MHDU are engineered to provide an attractive yield (4%–6%) while preserving upside potential, effectively eliminating the compromises inherent in traditional dividend and covered call funds.
Covered calls versus Mackenzie’s high dividend strategy
Covered call strategies: Understanding the income and return trade-off
The high yields offered by covered call strategies should not be viewed as a ‘free lunch’. Rather, they represent a trade-off: investors exchange potential future capital appreciation for incremental yield today.
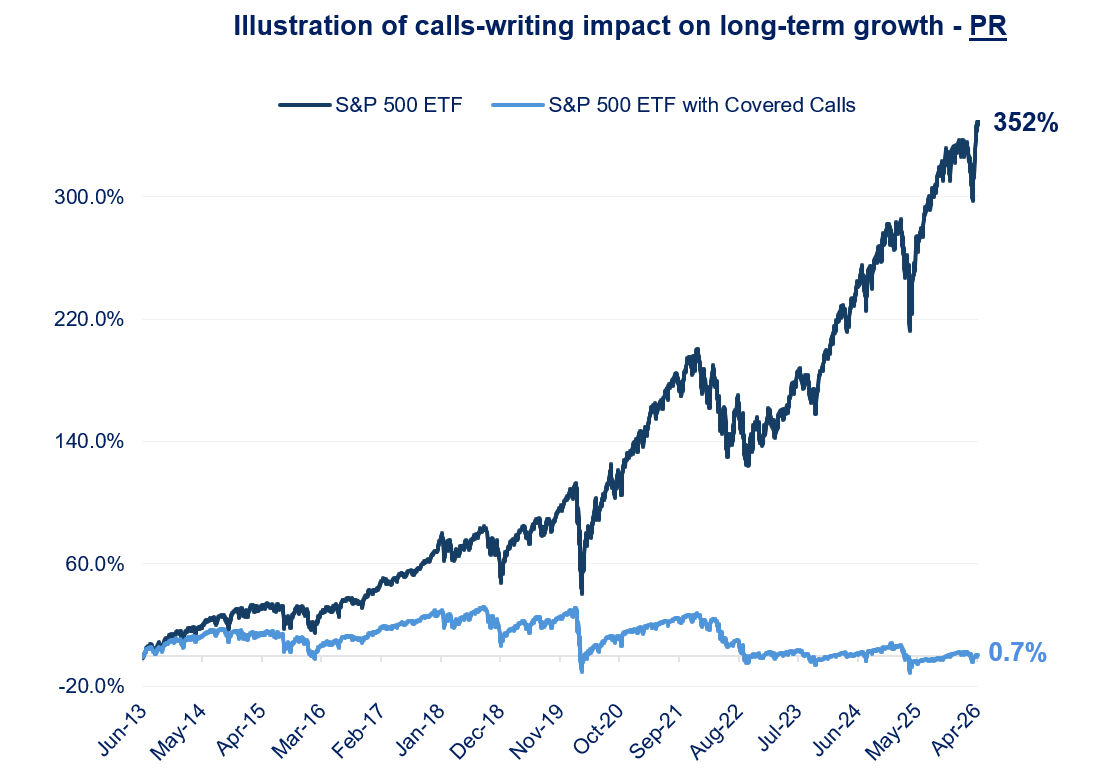
To demonstrate how covered call ETF yields are generated at the expense of upside participation, the charts below compare the performance of a standard S&P 500 ETF with an S&P 500 Covered Call ETF. The total return comparison reflects the reinvestment of distributions, a scenario that is largely counterintuitive for these strategies as capping upside potential makes little sense if cash income is not required. Meanwhile, the price return chart illustrates the true performance when those distributions are taken in cash.
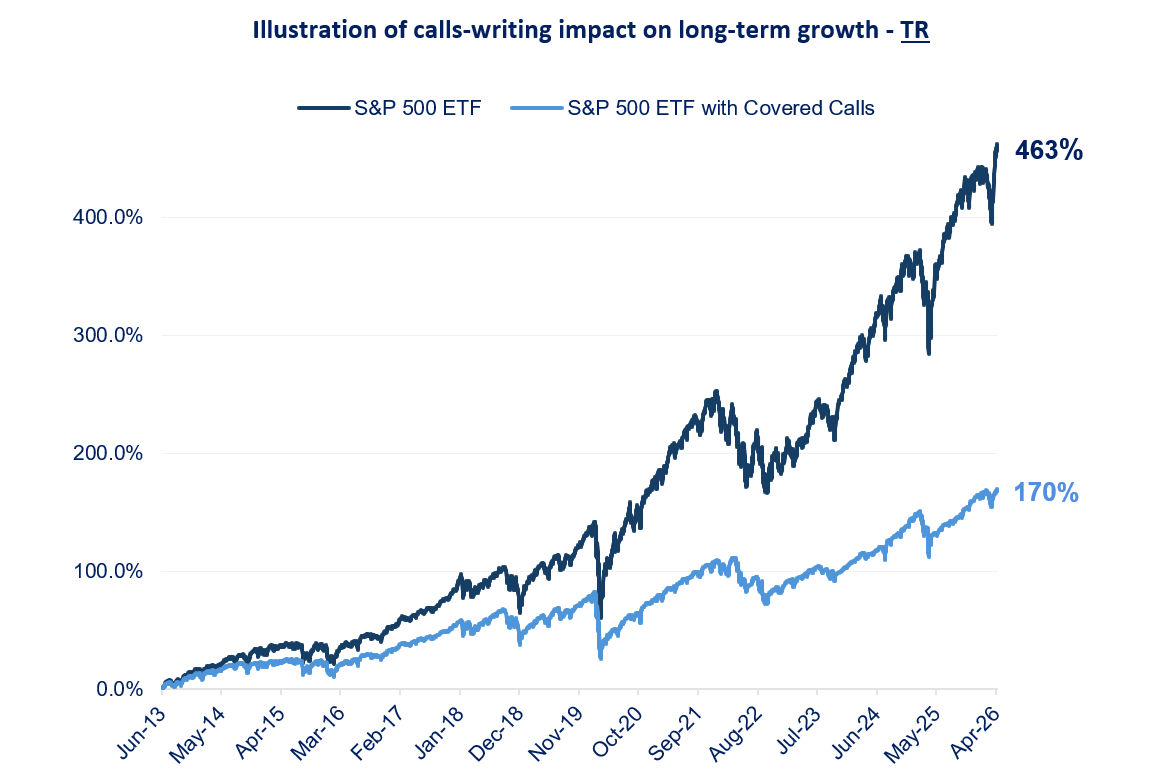 Source: Morningstar, As of April 30, 2026.
S&P 500 ETF: SPY – S&P 500 with covered calls ETF: XYLD
Source: Morningstar, As of April 30, 2026.
S&P 500 ETF: SPY – S&P 500 with covered calls ETF: XYLD
 Source: Morningstar, As of April 30, 2026.
S&P 500 ETF: SPY – S&P 500 with covered calls ETF: XYLD
Source: Morningstar, As of April 30, 2026.
S&P 500 ETF: SPY – S&P 500 with covered calls ETF: XYLD
Mackenzie’s high dividend approach
To overcome the upside capping of covered calls and still deliver an attractive yield, the Mackenzie Canadian High Dividend Yield ETF (MHDC) and Mackenzie US High Dividend Yield ETF (MHDU) employ a differentiated approach:
- Opportunistic options strategy (as opposed the covered call’s systematic call writing): By actively writing both call and put options, the ETFs can generate premium income in both rising and falling markets, effectively preserving greater upside participation.
- Amplified returns: Modest leverage is applied strategically to enhance both the yield and the total return potential of the underlying dividend portfolio.
ETF news & notes
Prediction markets like Polymarket are creating new opportunities for ETF investors. Recent filings from U.S. issuers such as Bitwise and Roundhill for election-linked ETFs could soon allow investors to trade the probabilities of real-world events directly through brokerage accounts, pending regulatory approval.
These ETFs would primarily invest in “event contracts,” which pay out based on the outcome of specific events, such as political elections. Contracts settle at $1.00 if the event occurs and $0.00 if it does not. Unlike traditional derivatives, these contracts are fully funded upfront, eliminating margin call risk.
Regulatory approval remains uncertain, as oversight responsibilities between financial and gaming regulators are still evolving. However, approval could pave the way for a broader range of event-driven investment products, including those tied to sports and other real-world outcomes.
ETF flows update
- On a year-to-date basis, as of May 15, 2026, total ETF inflows have reached $80.6 billion. Equity ETFs lead the way with $46.2 billion, followed by asset allocation ETFs at $15.9 billion, and fixed income at $14.8 billion.
- Canada focused ETFs have attracted the largest inflows of $25.6 billion.
- The total AUM for Canadian ETFs reached $830 billion.
- The number of listed ETFs: 1,998.
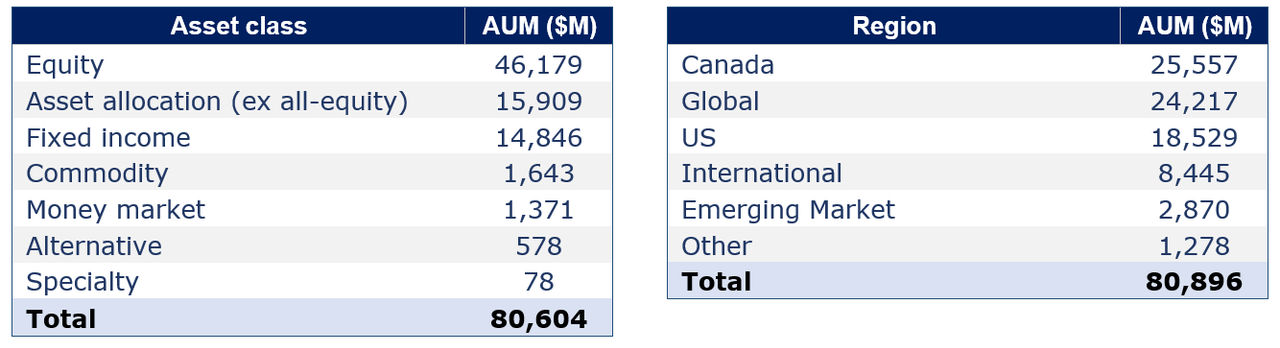 Source: Bloomberg and TD. As of May 15, 2026.
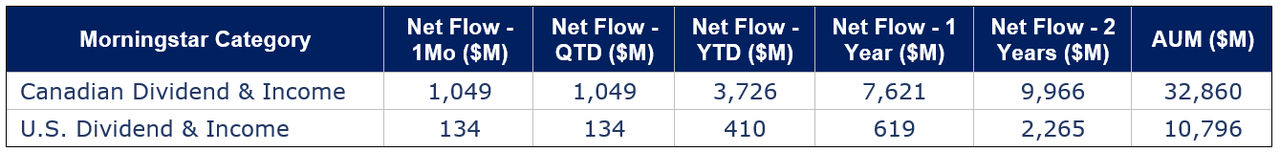 Source: Morningstar, As of April 30, 2026.
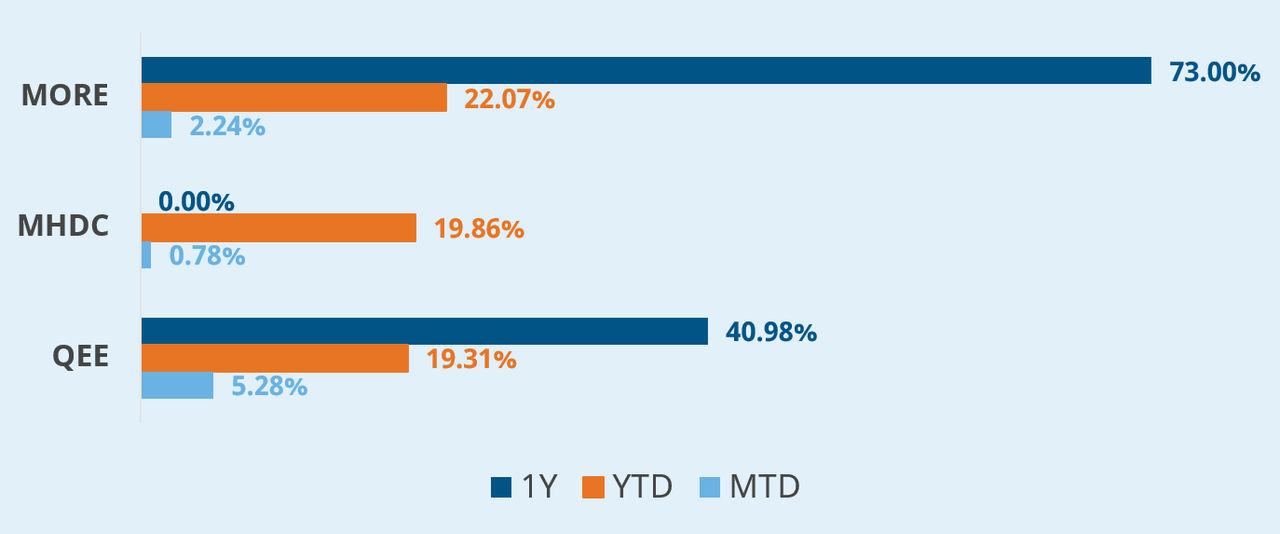
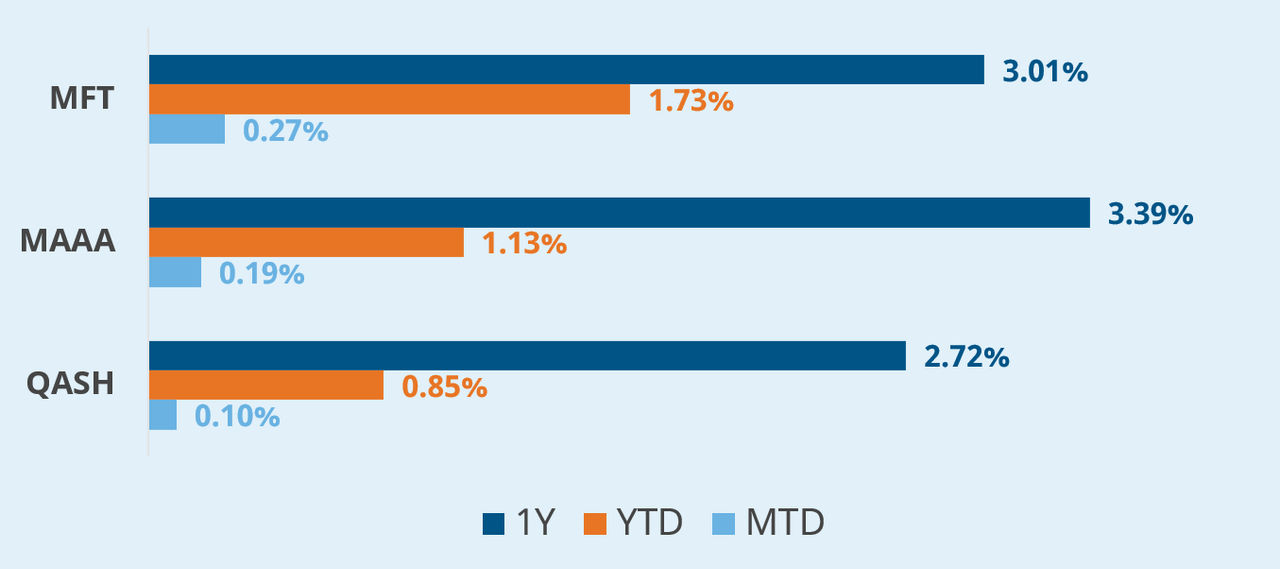
Mackenzie ETF top performers
Equity ETFs
Fixed Income ETFs
 Source: Mackenzie investments, data as of May 15, 2026.
FOR ADVISOR USE ONLY. No portion of this communication may be reproduced or distributed to the public as it does not comply with investor sales communication rules. Mackenzie disclaims any responsibility for any advisor sharing this with investors.
Commissions, brokerage fees, management fees, and expenses all may be associated with Exchange Traded Funds. Please read the prospectus before investing. The indicated rates of return are the historical annual compounded total returns, including in share or unit value and reinvestment of distributions and does not take into account sales, redemption, distribution, or optional charges or income taxes payable by any securityholder that would have reduced returns. Exchange Traded Funds are not guaranteed, their values change frequently, and past performance may not be repeated.
The content of this article (including facts, views, opinions, recommendations, descriptions of or references to, products or securities) is not to be used or construed as investment advice, as an offer to sell or the solicitation of an offer to buy, or an endorsement, recommendation or sponsorship of any entity or security cited. Although we endeavour to ensure its accuracy and completeness, we assume no responsibility for any reliance upon it.
This should not be construed as legal, tax or accounting advice. This material has been prepared for information purposes only. The tax information provided in this document is general in nature and each client should consult with their own tax advisor, accountant and lawyer before pursuing any strategy described herein as each client’s individual circumstances are unique. We have endeavored to ensure the accuracy of the information provided at the time that it was written, however, should the information in this document be incorrect or incomplete or should the law or its interpretation change after the date of this document, the advice provided may be incorrect or inappropriate. There should be no expectation that the information will be updated, supplemented or revised whether as a result of new information, changing circumstances, future events or otherwise. We are not responsible for errors contained in this document or to anyone who relies on the information contained in this document. Please consult your own legal and tax advisor.
This article may contain forward-looking information which reflect our or third party current expectations or forecasts of future events. Forward-looking information is inherently subject to, among other things, risks, uncertainties and assumptions that could cause actual results to differ materially from those expressed herein. These risks, uncertainties and assumptions include, without limitation, general economic, political and market factors, interest and foreign exchange rates, the volatility of equity and capital markets, business competition, technological change, changes in government regulations, changes in tax laws, unexpected judicial or regulatory proceedings and catastrophic events. Please consider these and other factors carefully and not place undue reliance on forward-looking information. The forward-looking information contained herein is current only as of May 15, 2026. There should be no expectation that such information will in all circumstances be updated, supplemented, or revised whether as a result of new information, changing circumstances, future events or otherwise.
Index performance does not include the impact of fees, commissions, and expenses that would be payable by investors in the investment products that seek to track an index.
The Mackenzie ETFs are not sponsored, promoted, sold or supported in any other manner by Solactive nor does Solactive offer any express or implicit guarantee or assurance either with regard to the results of using the Indices, trademarks and/or the price of an Index at any time or in any other respect. The Solactive Indices are calculated and published by Solactive. Solactive uses its best efforts to ensure that the Indices are calculated correctly. Irrespective of its obligations towards the Mackenzie ETFs, Solactive has no obligation to point out errors in the Indices to third parties including but not limited to investors and/or financial intermediaries of the Mackenzie ETFs. Neither publication of the Solactive Indices by Solactive nor the licensing of the Indices or related trade mark(s) for the purpose of use in connection with the Mackenzie ETFs constitutes a recommendation by Solactive to invest capital in said Mackenzie ETFs nor does it in any way represent an assurance or opinion of Solactive with regard to any investment in these Mackenzie ETFs.