.svg)
.svg)
The ETF Lab
ETF spotlight: Beyond rising yields
TL;DR: Higher starting yields have improved the income potential and resilience of fixed income, but interest-rate and credit risks remain important. In this environment, investors may benefit from a flexible approach that can adjust duration, yield-curve exposure and credit positioning as market conditions change.
After several years of challenging bond markets, investors may be reassessing the role of fixed income in their portfolios. Elevated interest-rate volatility, persistent inflation uncertainty and shifting monetary policy expectations have created a more complex environment for bonds, contributing to periods of heightened volatility and weaker returns.
But challenging bond-market conditions do not necessarily mean fixed income is unattractive.
Today’s yields continue to make a compelling case for fixed income. What has changed is not the role of fixed income, but how investors may consider gaining exposure to it.
Higher yields have rebuilt the foundation for fixed income
For much of the decade following the global financial crisis, historically low yields constrained bond income while leaving investors vulnerable to rising rates. That environment has changed.
At the end of September, Government of Canada yields ranged from approximately 3.4% for 2-year bonds to 4.0% for 10-year bonds, with long-term bonds yielding around 4.3%.
Higher starting yields strengthen the role of fixed income in two ways: they provide more meaningful income as a source of total return and create a greater cushion against price declines when rates rise.
Together, these benefits have helped restore the traditional role of bonds in diversified portfolios: generating income, preserving capital and providing diversification against equity risk.
For example, a portfolio with a duration of 6 years would be expected to experience approximately:
- 1% decrease in yields → ~6% increase in price
- 1% increase in yields → ~6% decrease in price
This is the price impact only. Total return also includes the income earned from the portfolio, which can provide a cushion when yields rise.
If the portfolio has a 5% yield and a 6-year duration, a simplified one-year illustration would be:
Scenario | Approx. price impact | Starting income/yield | Approx. total-return effect* |
Yields fall 1% | 6% | 5% | ~+11% |
Yields unchanged | — | 5% | ~+5% |
Yields rise 1% | -6% | 5% | ~-1% |
*Simplified illustration before considering convexity, reinvestment, spread movements, fees and other factors.
Attractive yields do not mean an easy bond market
Higher yields do not eliminate risk, nor is the opportunity distributed evenly across maturities and fixed-income sectors. Canada’s five-year government bond yield, for example, rose from 3.01% at the end of June to roughly 3.7% in late September, putting pressure on bond prices despite improving income potential.
With inflation, monetary policy, economic growth and government borrowing continuing to influence yields, investors face an important question: How much interest-rate risk should they take to capture today’s attractive yields?
Extending duration can provide greater upside if rates decline but can amplify losses if yields rise. Conversely, remaining too defensive may sacrifice income and diversification benefits.
The objective, therefore, is not simply to minimize duration or credit risk, but to take those risks deliberately where investors are adequately compensated.
Building portfolio resilience with MKB
Rather than simply accepting the exposures represented in a benchmark, active management provides the ability to adjust positioning as market conditions evolve. That can mean changing interest-rate sensitivity, identifying opportunities across different parts of the yield curve, adjusting allocations between government and corporate bonds, or reducing exposure when credit risks appear less adequately compensated.
The Mackenzie Core Plus Canadian Fixed Income ETF (MKB) uses this flexibility to seek participation in bond-market returns while emphasizing risk management, capital preservation and downside protection.
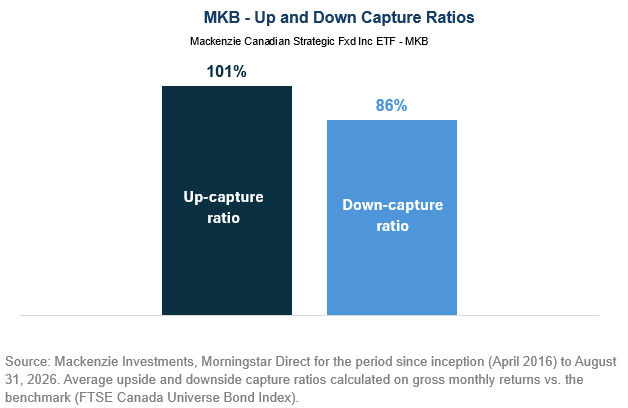
Since inception through September 2026, MKB captured approximately 101% of the index’s upside and 86% of its downside.
ETF | Net Returns (%) | Peers Beaten (%) | ||||
1Y | 3Y | 5Y | 10Y | SI * | 10Y | |
Mackenzie Canadian Strategic Fixed Income ETF (MKB) | -1.38 | 4.80 | 0.42 | 1.76 | 2.08 | 92% |
FTSE Canada Universe | -1.10 | 4.75 | 0.30 | 1.29 | 1.60 | |
Excess | -0.27 | 0.05 | 0.13 | 0.47 | 0.48 |
|
Source: Mackenzie Investments. As of September 30, 2026. *Since inception: April 30, 2016.
With yields once again providing a meaningful foundation for returns, MKB offers a flexible approach to core Canadian fixed income, seeking to capture the opportunities available in today's bond market while helping build a more resilient portfolio.
TICKER | Product Name | Inception Date | Mgmt. Fee | Morningstar Rating | Awards |
MKB | Mackenzie Canadian Strategic Fixed Income ETF | 2016-04-19 | 0.80% | 5 | 2025 Fundata FundGrade A+ |
ETF news & notes
CSA and CIRO issue guidance on foreign-listed ETF practices
The Canadian Securities Administrators (CSA) and the Canadian Investment Regulatory Organization (CIRO) have issued Staff Notice 81-339, which sets out guidance on industry practices relating to the marketing and sale of exchange-traded funds (ETFs) that are listed on a foreign exchange but not on a Canadian exchange.
The guidance responds to stakeholder feedback received by the CSA regarding the availability of foreign ETFs to Canadian investors through Canadian registered dealers. While there is broad support for continued investor access to foreign ETFs, some stakeholders raised concerns and highlighted a need for enhanced disclosure to assist investors.
ETF flows update
- Canadian ETFs attracted $18.2 billion in September, taking 2026 YTD inflows to $156.8 billion. That is already above the previous full-year record, and monthly inflows have exceeded $13 billion for 11 consecutive months. Equity ETFs account for roughly $103 billion, or about two-thirds of YTD flows.
- The total AUM for Canadian ETFs reached $933 billion on a net basis and $1,071 billion on gross basis.
- Active ETF assets reached approximately $334 billion in September 2026, more than triple their level at the end of 2022. Active strategies represented about 32% of Canadian ETF assets, compared with just 2.9% in 2010.
- The strongest regional momentum remains in international and global regions, where inflows outpaced those of the US and Canada relative to their asset bases. The Ex-North America (combined international and global) led with $61 billion in YTD inflows.
Asset class | YTD Flows ($M) |
Equity | 109,348 |
Fixed income | 32,600 |
Asset allocation (ex all-equity) | 13,490 |
Commodity | 1,085 |
Crypto | 290 |
Total | 156,814 |
Source: Bloomberg and NBF. As of September 30, 2026.
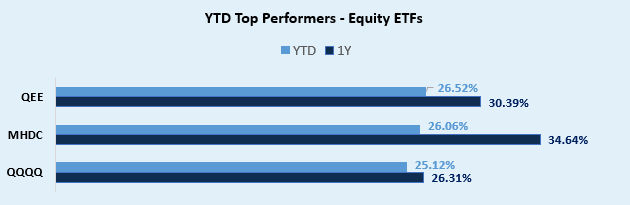
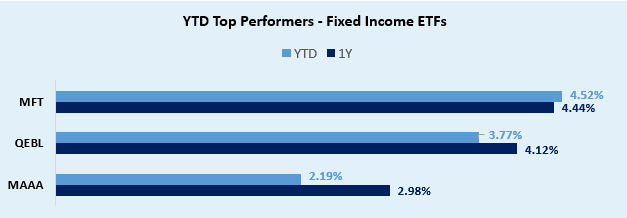
Mackenzie ETF top performers
Equity ETFs
Fixed Income ETFs
Source: Mackenzie Investments, data as of September 30, 2026.
FOR ADVISOR USE ONLY. No portion of this communication may be reproduced or distributed to the public as it does not comply with investor sales communication rules. Mackenzie disclaims any responsibility for any advisor sharing this with investors.
Commissions, management fees, brokerage fees and expenses may all be associated with Exchange Traded Funds. Please read the prospectus before investing. The indicated rates of return are the historical annual compounded total returns including changes in unit value and reinvestment of all distributions, and do not take into account sales, redemption, distribution, or optional charges or income taxes payable by any security holder that would have reduced returns. Exchange Traded Funds are not guaranteed, their values change frequently, and past performance may not be repeated.
The content of this article (including facts, views, opinions, recommendations, descriptions of or references to, products or securities) is not to be used or construed as investment advice, as an offer to sell or the solicitation of an offer to buy, or an endorsement, recommendation or sponsorship of any entity or security cited. Although we endeavour to ensure its accuracy and completeness, we assume no responsibility for any reliance upon it.
This document may contain forward-looking information which reflect our or third party current expectations or forecasts of future events. Forward-looking information is inherently subject to, among other things, risks, uncertainties and assumptions that could cause actual results to differ materially from those expressed herein. These risks, uncertainties and assumptions include, without limitation, general economic, political and market factors, interest and foreign exchange rates, the volatility of equity and capital markets, business competition, technological change, changes in government regulations, changes in tax laws, unexpected judicial or regulatory proceedings and catastrophic events. Please consider these and other factors carefully and not place undue reliance on forward-looking information. The forward-looking information contained herein is current only as of October 7, 2026. There should be no expectation that such information will in all circumstances be updated, supplemented or revised whether as a result of new information, changing circumstances, future events or otherwise.
Index performance does not include the impact of fees, commissions, and expenses that would be payable by investors in the investment products that seek to track an index.
Morningstar Ratings reflect performance of Mackenzie Canadian Strategic Fixed Income ETF (MKB) as of August 31, 2026 and are subject to change monthly. The ratings are an objective, quantitative measure of a fund’s historical risk-adjusted performance relative to other funds in its category. Only funds with at least a three-year track record are considered. The overall star rating for a fund is a weighted combination calculated from a fund’s 3, 5, and 10-year returns, as available, measured against the 91-day treasury bill and peer group returns. A fund can only be rated if there are a sufficient number of funds in its peer group to allow comparison for at least three years. If a fund scores in the top 10% of its fund category, it gets 5 stars; if it falls in the next 22.5%, it receives 4 stars; a place in the middle 35% earns a fund 3 stars; those in the next 22.5% receive 2 stars; and the lowest 10% receive 1 star. For more details on the calculation of Morningstar Ratings, see www.morningstar.ca.
Mackenzie Canadian Strategic Fixed Income ETF (MKB), Canadian Fixed Income category: overall rating – 5 stars (346 funds), 3 years – 4 stars (346 funds), 5 years – 4 stars (321 funds), 10 years – 5 stars (224 funds), as of August 31, 2026.
©2026 Morningstar Research Inc. All Rights Reserved. The information contained herein: (1) is proprietary to Morningstar; (2) may not be copied or distributed; and (3) is not warranted to be accurate, complete, or timely. Neither Morningstar nor its content providers are responsible for any damages or losses arising from any use of this information. Past performance is no guarantee of future results.
About Fundata Canada Inc.
Fundata Canada Inc. has been providing data aggregation and dissemination services to the Canadian media and financial marketplace since 1987. Fundata is a major provider in the distribution of fund and stock information in Canada.
About the Fundata FundGrade A+ Rating
FundGrade A+® is used with permission from Fundata Canada Inc., all rights reserved. The annual FundGrade A+® Awards are presented by Fundata Canada Inc. to recognize the “best of the best” among Canadian investment funds. The FundGrade A+® calculation is supplemental to the monthly FundGrade ratings and is calculated at the end of each calendar year. The FundGrade rating system evaluates funds based on their risk-adjusted performance, measured by Sharpe Ratio, Sortino Ratio, and Information Ratio. The score for each ratio is calculated individually, covering all time periods from 2 to 10 years. The scores are then weighted equally in calculating a monthly FundGrade. The top 10% of funds earn an A Grade; the next 20% of funds earn a B Grade; the next 40% of funds earn a C Grade; the next 20% of funds receive a D Grade; and the lowest 10% receive an E Grade. To be eligible, a fund must have received a FundGrade rating every month in the previous year. The FundGrade A+® uses a GPA-style calculation, where each monthly FundGrade from “A” to “E” receives a score from 4 to 0, respectively. A fund’s average score for the year determines its GPA. Any fund with a GPA of 3.5 or greater is awarded a FundGrade A+® Award. For more information, see www.FundGradeAwards.com. Although Fundata makes every effort to ensure the accuracy and reliability of the data contained herein, the accuracy is not guaranteed by Fundata.
Mackenzie Canadian Strategic Fixed Income ETF (MKB) was recognized for outstanding fund performance at the 2025 Fundata FundGrade A+® Awards in the Canadian Fixed Income category out of a total of 110 funds. Performance for the fund for the period ended December 31, 2025 is as follows: 2.9% (1 year), 4.7% (3 years), -0.1% (5 years) and 2.3% (since inception – April 2016).