
Written by the Mackenzie Fixed Income Team
Key Highlights
- U.S. Treasuries remain a global safe haven, supported by strong institutional credibility and resilient fiscal dynamics, with recent issuance trends and tariff revenues helping stabilize long-end supply concerns.
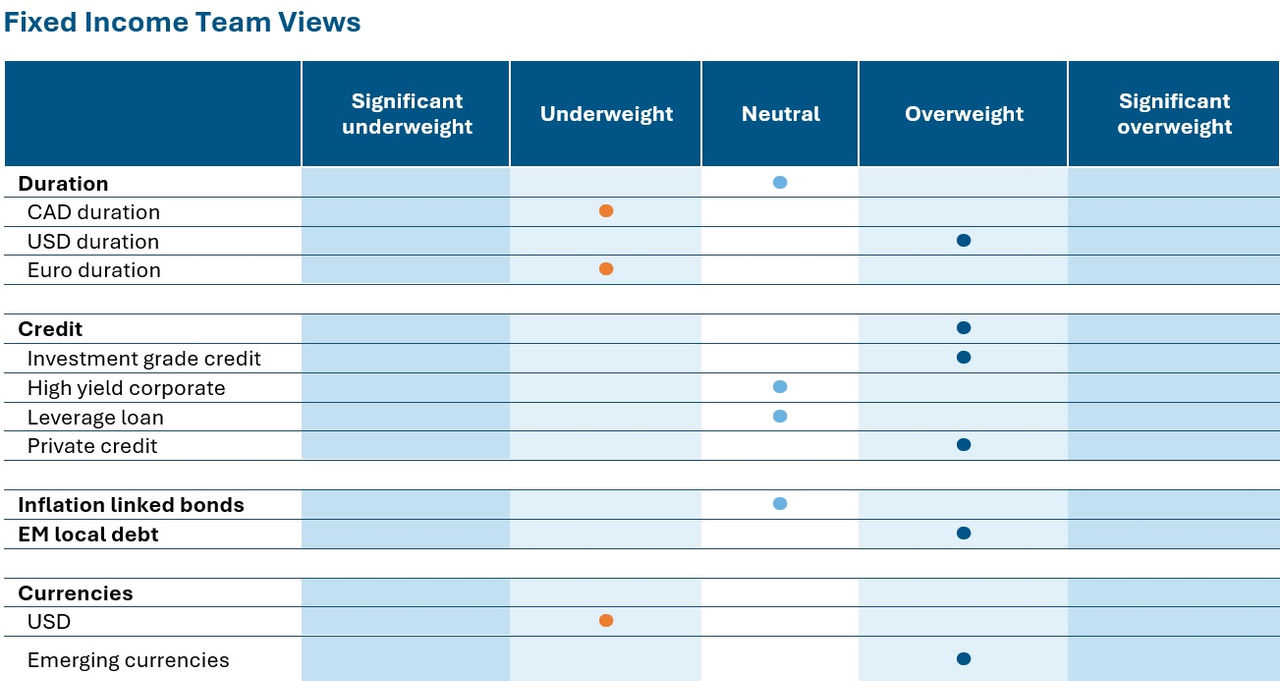
- While overall duration exposure remains neutral, the portfolio reflects meaningful regional positioning—underweight Canada and Europe, overweight U.S.—to capitalize on diverging rate paths and policy dynamics.
- Despite tight spreads and a broadly expensive credit market, restructuring activity and LMEs in the leveraged space are rising, requiring active monitoring and credit event recognition.
- The portfolio has increased exposure to EM local debt and currencies, particularly in Brazil, Mexico, South Africa, and Peru, reflecting a constructive view on EM fundamentals and dollar weakness.
 Source: Mackenzie Investments. As of July 31, 2025.
Fixed Income Market Update
The U.S. remains the issuer of the world’s reserve currency, supported by a robust economy, military strength, and deep, liquid financial markets. While its dominance may be debated, its safe haven status remains intact. Investors have consistently turned to Treasuries during major market disruptions, and they’ve been rewarded. This long-standing track record has created a reflexive trust: when fear rises, flows return to what’s proven dependable. U.S. government bonds carry an added layer of security. Unlike corporations, sovereign nations like the U.S. have powerful tools at their disposal i.e. taxation, monetary issuance, and fiscal flexibility. These capabilities significantly reduce default risk and underpin the role of Treasuries as a cornerstone of global capital markets.
The landscape has evolved meaningfully in the last couple of months. One of the key concerns at the time, that of, excessive debt issuance tied to the One Big Beautiful Bill Act (OBBBA) has not materialized to the extent many feared. The U.S. Treasury ended up adding less debt than anticipated, and importantly, tariff revenues have come in stronger than expected, providing a helpful offset. The Congressional Budget Office (CBO) also scored the OBBBA quite favorably, factoring in the higher tariff receipts. As a result, the anticipated pressure on issuance—particularly at the long end—has not emerged as a significant driver. Instead, issuance has been concentrated in bills, which has helped alleviate concerns around duration supply.
Further reinforcing this, the Treasury’s latest quarterly refunding indicated that it is well-positioned on its debt needs for the coming quarters. This suggests a more stable outlook for supply dynamics in the near term.
Looking ahead, the risks to long-end Treasuries appear to be more nuanced. First, if inflation remains elevated while the Fed begins to cut rates, nominal bonds could struggle—making inflation-protected securities like QTIPs relatively attractive. Second, there’s a more structural concern around the credibility of U.S. institutions. If confidence in entities like the Fed or BLS erodes, the perceived safe-haven status of U.S. assets could diminish.
Fund Positioning
Our broad duration stance remains neutral, but we've made meaningful adjustments at the regional level. We hold underweight positions in Canadian and European duration, while maintaining an overweight in U.S. duration. Historically, these markets have traded in close correlation, which supports our use of futures for hedging. However, correlations particularly between Canada and the U.S. have weakened significantly over the past year. The divergence is even more pronounced between European and North American rates, underscoring the growing differentiation across global fixed income markets.
This shift reflects a broader theme that the global rates landscape is becoming increasingly multi-polar, driven by divergent economic conditions and policy paths. As a result, spread trades across regions have become a key source of alpha, and we’ve allocated risk accordingly. While U.S. 10-year rates have been relatively stable, the real action lies in cross-market positioning.
In credit, the environment remains expensive and relatively uneventful at the index level, with tight spreads and limited broad-based risk. However, idiosyncratic risk is elevated, particularly in the leveraged loan space, where we’re seeing a rise in restructurings and liability management exercises (LMEs). These events, while not always formal defaults, are treated as credit events in our framework and require active monitoring.
On the inflation-linked side, we currently hold no active positions. However, we’ve made a notable shift in emerging market local debt, which should now be reflected as overweight. We've increased exposure across several regions, including Brazil, Mexico and recent additions in South Africa and Peru, while trimming Indonesian holdings. These positions are primarily held in our global and unconstrained mandates but have also been added to Canadian portfolios.
In FX, we maintain a strategic underweight to the U.S. dollar, consistent with our longer-term view of dollar weakness. While we’ve taken a short-term tactical position around USMCA-related developments, our broader conviction remains intact.
Central Bank Watch
Region | Latest CPI Inflation | Policy rate | Latest policy action | Next decision date | Market expectation | Outlook |
Canada | 1.90% | 2.75% | No change | 17-Sep-25 | No change | Underweight |
United States | 2.70% | 4.50% | No change | 11-Sep-25 | Rate cut | Overweight |
Eurozone | 2.00% | 2.15% | No change | 11-Sep-25 | No change | Neutral |
Japan | 3.30% | 0.50% | No change | 19-Sep-25 | No change | Underweight |
New Zealand | 2.70% | 3.25% | No change | 19-Aug-25 | No change | Neutral |
Credit market performance
High yield bonds delivered coupon-like returns in July, with performance skewed toward lower-rated credits as investors navigated a mix of macro headlines, encouraging early earnings reports, and resilient economic data. Notably, CCC-rated bonds extended their outperformance streak for a third consecutive month, reflecting investor appetite for risk amid improving sentiment. Sector-wise, Telecom (+1.56%) and Media (+1.30%) led gains, while Retail (-0.17%) and Chemicals (-0.16%) were the only sectors to post negative returns.
July’s performance by rating highlights investors’ increasing risk appetite driven by continued strength in secondary prices. Market sentiment remained buoyant, with 47% of loans priced at par or above by month-end, signaling renewed investor confidence. Technical conditions leaned heavily in favor of borrowers, as a supply-demand imbalance reached a 14-month high. This was largely fueled by robust CLO issuance amid a backdrop of limited new loan supply, creating a supportive environment for existing credits. B rated loans representing ~63% returned 0.97% for the month, outpacing the 0.59% gain by the smaller BB index, which represents about 20% of the market. The riskiest corner of the market CCC rated loans led performance in July with a robust 1.50% return.
Index | Yield | Yield m/m | Spread | Spread m/m | Performance (%) | |||
bp | bp | bp | 1m | 3m | YTD | 1Y | ||
Investment Grade | ||||||||
CA | 4.1% | 0 | 89 | -13 | 0.0 | 1.2 | 2.2 | 6.0 |
US | 5.1% | +6 | 79 | -7 | 0.1 | 2.0 | 4.4 | 4.7 |
High Yield |
|
|
|
| ||||
CA | 6.2% | -9 | 283 | -25 | 0.8 | 3.0 | 3.9 | 8.8 |
US | 7.3% | -3 | 286 | -10 | 0.4 | 4.0 | 5.0 | 8.6 |
US Leverage Loans | 8.3% | -8 | 391 | -9 | 0.7 | 2.8 | 2.7 | 6.0 |
Commissions, trailing commissions, management fees, and expenses all may be associated with mutual fund investments. Please read the prospectus before investing. The indicated rates of return are the historical annual compounded total returns as of July 31, 2025, including changes in share value and reinvestment of all distributions and does not take into account sales, redemption, distribution, or optional charges or income taxes payable by any security holder that would have reduced returns. Mutual funds are not guaranteed, their values change frequently, and past performance may not be repeated. Index performance does not include the impact of fees, commissions, and expenses that would be payable by investors in the investment products that seek to track an index.
This document may contain forward-looking information which reflect our or third party current expectations or forecasts of future events. Forward-looking information is inherently subject to, among other things, risks, uncertainties and assumptions that could cause actual results to differ materially from those expressed herein. These risks, uncertainties and assumptions include, without limitation, general economic, political and market factors, interest and foreign exchange rates, the volatility of equity and capital markets, business competition, technological change, changes in government regulations, changes in tax laws, unexpected judicial or regulatory proceedings and catastrophic events. Please consider these and other factors carefully and not place undue reliance on forward-looking information. The forward-looking information contained herein is current only as of July 31, 2025. There should be no expectation that such information will in all circumstances be updated, supplemented or revised whether as a result of new information, changing circumstances, future events or otherwise.
The content of this commentary (including facts, views, opinions, recommendations, descriptions of or references to, products or securities) is not to be used or construed as investment advice, as an offer to sell or the solicitation of an offer to buy, or an endorsement, recommendation or sponsorship of any entity or security cited. Although we endeavour to ensure its accuracy and completeness, we assume no responsibility for any reliance upon it.
All information is historical and not indicative of future results. Current performance may be lower or higher than the quoted past performance, which cannot guarantee results. Share price, principal value, and return will vary, and you may have a gain or a loss when you sell your shares. Performance assumes reinvestment of distributions and does not account for taxes. Performance may not reflect any expense limitation or subsidies currently in effect. Short-term trading fees may apply.
This material is for informational and educational purposes only. It is not a recommendation of any specific investment product, strategy, or decision, and is not intended to suggest taking or refraining from any course of action. It is not intended to address the needs, circumstances, and objectives of any specific investor. Mackenzie Investments, which earns fees when clients select its products and services, is not offering impartial advice in a fiduciary capacity in providing this sales and marketing material. This information is not meant as tax or legal advice. Investors should consult a professional advisor before making investment and financial decisions and for more information on tax rules and other laws, which are complex and subject to change.
The rate of return is used only to illustrate the effects of the compound growth rate and is not intended to reflect future values of the mutual fund or returns on investment in the mutual fund.