Value: The overlooked area of the market
IN THIS ARTICLE min read
Barrow Hanley Global Investors
In a market shaped by narrow leadership and heavy concentration in mega-cap growth stocks, value has remained more competitive than headlines suggest. Over the five years ending December 31, 2025, active global value managers generally delivered stronger relative results than active global growth managers, supported by:
- better downside resilience
- more grounded valuations
- an evolving market and macroeconomic backdrop
An interrogation of the narrative reveals how value investing can offer a compelling response to an imbalanced market.
Why the market narrative may be incomplete
Over the past several years, market conversations have been dominated by a narrow set of themes: mega-cap technology stocks, inflation, interest rates, tariffs and geopolitical risk. That backdrop has reinforced the view that growth has been the style most likely to generate excess returns.
However, the broader performance picture is less one-sided. Growth stocks delivered strong leadership in 2023 and 2024, and the growth narrative remained dominant in 2025 even though the performance gap between growth and value was relatively small that year. Yet over the full five-year period ending December 31, 2025, the MSCI World Growth Index outperformed the MSCI World Value Index by only about 100 basis points. A key reason was 2022, when the MSCI World Growth fell by more than 29% while the MSCI World Value declined by less than 7%. That difference underscores an important point for investors: strong upside years can shape sentiment, but downside protection can materially influence full-cycle results.
What five years of results say about growth and value
Index performance alone does not tell the full story for active managers: despite favourable conditions for growth benchmarks, active global growth managers generally struggled to keep pace with both the broader market and their own style index.
Over the one-, three- and five-year periods ending December 31, 2025, the median manager in the eVestment Global Growth universe lagged the MSCI World and MSCI World Growth indices. Roughly 90% of growth managers in the category failed to outperform their style index over both the three- and five-year periods.1
Table 1: Global growth universe performance (as at December 31, 2025)
1Y | 3Y | 5Y | |
MSCI World | 21.09% | 21.17% | 12.15% |
MSCI World Growth | 21.14% | 27.85% | 12.38% |
Median growth manager | 15.70% | 17.42% | 6.58% |
Source: eVestment.
The experience for active global value managers was notably stronger. Over the one-year period, the median value manager outperformed the median growth manager and the MSCI World and MSCI World Value indices. Relative to the median growth manager, the median value manager trailed only modestly in performance over three years and outperformed over five years. Over that five-year span, 45% of value managers outperformed the broader index and 55% outperformed the MSCI World Value Index.2
Table 2: Global value universe performance (as at December 31, 2025)
1Y | 3Y | 5Y | |
MSCI World | 21.09% | 21.17% | 12.15% |
MSCI World Value | 20.79% | 14.51% | 11.35% |
Median value manager | 24.87% | 16.96% | 11.61% |
Source: eVestment.
For investors, the implication is not that growth should be dismissed. Effective growth managers exist, and diversification across styles remains important. The more practical takeaway is that active value has offered a better probability of competitive relative outcomes than the headline market narrative may suggest.
A discussion on market concentration
One reason for the disconnect between perception and manager outcomes is market concentration. By 2025, the top 10 stocks in the S&P 500 Index accounted for 41% of the index, well above the previous peak of 22% reached in March 20003. Much of that concentration was tied to a small number of mega-cap growth-related names.
This helped create the appearance of a broadly strong growth environment, even though leadership was unusually narrow. For active managers, narrow leadership can make outperformance harder to achieve: a diversified valuation-conscious portfolio may still lag if it does not hold a small cluster of index-dominating stocks in sufficient size. This helps explain why growth benchmarks looked strong while many active growth managers still fell short.
It also raises a useful historical parallel: the current environment shares some features with the early 2000s, when high concentration and elevated valuations were followed by a prolonged period in which technology-related and growth stocks lagged as valuations normalized. History does not repeat exactly, but it can provide a reminder that concentrated leadership does not last forever and that style leadership can shift meaningfully over time.
Why value deserves a closer look
The case for value is based both on backward-looking relative performance and on the current macro and valuation backdrop.
Since the COVID period, inflation and interest rates have moved higher, and value stocks initially performed meaningfully better before giving back some of those gains in 2023 and 2024 as markets focused on lower-rate hopes and enthusiasm around artificial intelligence. Even after that retracement, value stocks continue to trade today at historically low levels relative to growth peers, as seen in Chart 1 below. A narrowing of that valuation gap toward longer-term norms could provide support for value-oriented strategies.
Chart 1: Value is trading at historically low extremes relative to growth (December 31, 2001 – December 31, 2025)
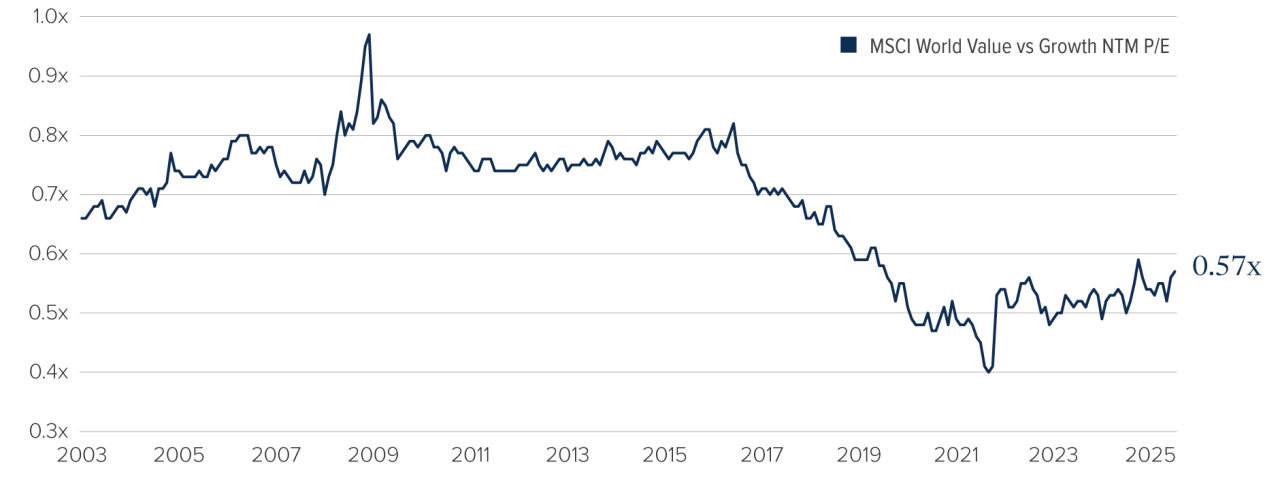
Source: FactSet.
The policy backdrop may also be shifting in ways that could benefit more cyclical parts of the market. Germany has increased allowable debt limits and approved greater infrastructure and defence spending. China, after a prolonged period of limited stimulus, may also face pressure to support economic growth more meaningfully. A more pro-growth policy mix globally could favour cyclical sectors and businesses more commonly associated with value.
Another part of the argument is regime change: the era of zero inflation and near-zero interest rates appears to have ended. In such an environment, long-duration growth assets may face a less supportive backdrop than they did in the previous decade. Meanwhile, value stocks may benefit from greater sensitivity to nominal growth, more grounded valuations and a stronger cushion in periods of multiple compression.
Implications for investors
The strongest conclusion is not that portfolios should rotate entirely away from growth. It is that style balance still matters, especially when market leadership is narrow and highly concentrated. Recent headlines have made growth feel like the only place where excess returns could be found, but the underlying manager data suggests otherwise.
For investors building diversified portfolios, active value remains relevant for three reasons:
- It has offered stronger relative manager outcomes than active growth over the past five years.
- It has provided meaningful downside resilience in weak markets.
- It continues to trade from a valuation base that leaves room for potential upside.
In an environment where concentration risk remains elevated and macro conditions are evolving, value may be less a contrarian call than a disciplined response to an imbalanced market.
A consistent value discipline
Barrow Hanley’s case rests on longevity, discipline and experience across market cycles. With more than 45 years of active investment management and a global portfolio management team averaging more than 30 years of experience, the firm brings a tested value discipline to today’s markets.
1 eVestment.
2 eVestment.
3 Strategas Research Partners.
Commissions, trailing commissions, management fees, and expenses all may be associated with mutual fund or ETF investments. Please read the prospectus before investing. Investment funds are not guaranteed, their values change frequently and past performance may not be repeated. Index performance does not include the impact of fees, commissions, and expenses that would be payable by investors in the investment products that seek to track an index.
This document includes forward-looking information that is based on forecasts of future events as of March 19, 2026. Mackenzie Financial Corporation will not necessarily update the information to reflect changes after that date. Forward-looking statements are not guarantees of future performance and risks and uncertainties often cause actual results to differ materially from forward-looking information or expectations. Some of these risks are changes to or volatility in the economy, politics, securities markets, interest rates, currency exchange rates, business competition, capital markets, technology, laws, or when catastrophic events occur. Do not place undue reliance on forward-looking information. In addition, any statement about companies is not an endorsement or recommendation to buy or sell any security.
The content of this commentary (including facts, views, opinions, recommendations, descriptions of or references to, products or securities) is not to be used or construed as investment advice, as an offer to sell or the solicitation of an offer to buy, or an endorsement, recommendation or sponsorship of any entity or security cited. Although we endeavour to ensure its accuracy and completeness, we assume no responsibility for any reliance upon it.