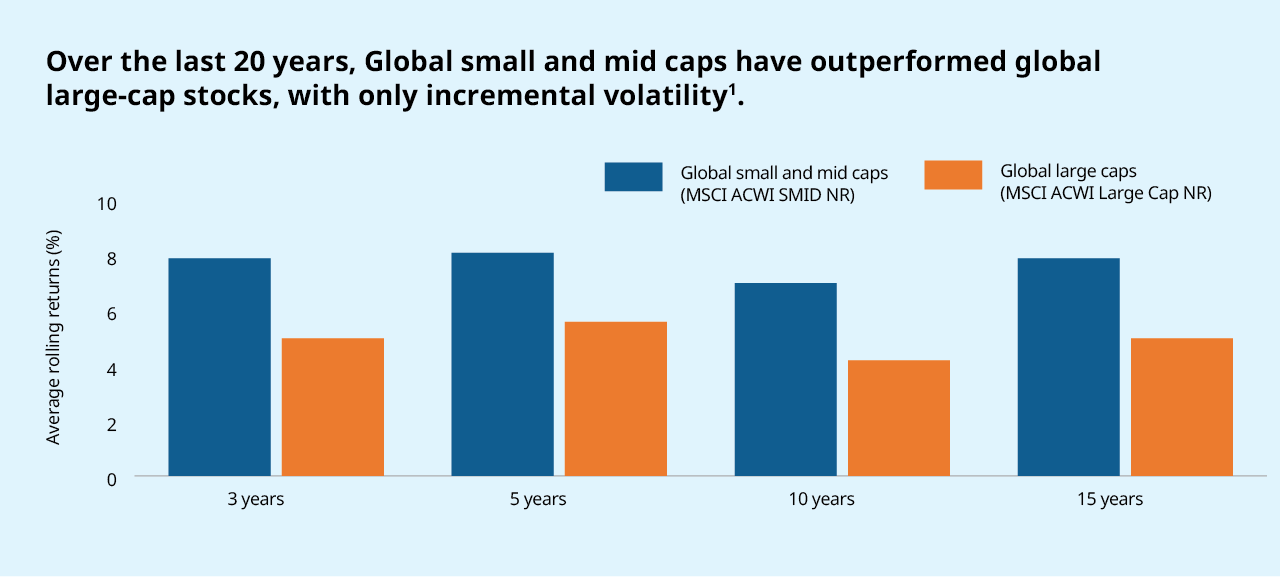
Why you need global small and mid caps in your portfolio
Canadian investors often feel more comfortable investing in large, stable and established Canadian companies. However, this can have a negative impact on your portfolio’s return potential and bring a lack of diversification. Global small and mid cap stocks, which consist of small and mid sized businesses, make up over two-thirds of the exchange-listed companies around the world. Despite this, Canadian investors tend to overlook them. These businesses have historically provided strong returns and have the potential to be leading companies of the future.
Why Mackenzie Global Small-Mid Cap Fund
Gain access to a fund that can bring growth potential and diversification benefits to your portfolio.
Higher growth potential:
The fund aims to invest in high-quality growth companies that create value by developing better, faster and cheaper products and services. The fund managers also seeks out companies that tend to have longterm and more consistent trends over time, and have the potential to grow even during an economic downturn (rather than being seasonal or cyclical and therefore affected by economic cycles).
Diversifies and enhances your returns:
The fund offers global exposure with a unique combination of three investment teams that are regional experts in small and mid cap stocks in the US, Europe and Asia. Adding smaller global companies to a portfolio can improve potential returns, with only a slight increase in risk. The expertise of the team creates the potential to outperform the market.
How it works
Uncovers unrecognized growth potential:
The investment teams carry out in-depth analysis of global small and mid cap companies. They then aim to build a portfolio of high-quality, innovative businesses, whose growth is less dependent on the broader economy. The teams also concentrate on companies with competitive advantages and unrecognized growth potential, which are driven by long-term trends. The focus is on high quality companies with strong management, stable financials and a reasonable price. They also seek out companies looking to use their substantial profits to finance growth opportunities.
Finds diamonds in the rough:
There is a massive breadth of small and mid cap companies, with around 11,000 stocks listed globally. Researching these companies is challenging and timeconsuming. These companies also tend to have limited analyst research available, which can lead to mispricing of the companies. This in turn brings opportunities for our investment team of experts to scour for high-quality companies with growth potential.
Why invest with Mackenzie
As a Canadian-owned global asset management provider, we’ve been helping advisors deliver the best possible advice and investment solutions for more than 50 years. With over C$200 billion in assets under management and a comprehensive line of investment solutions, we are one of Canada’s leading asset management companies. Our journey began with one client and one advisor working together, and though we’ve grown, we remain committed to the same belief, advice matters. When we work together with advisors and investors, we can achieve better financial outcomes.
To learn how the Mackenzie Global Small-Mid Cap Fund can help you achieve your financial goals, speak to your investment advisor today
Source: Morningstar, as of January 31, 2021. *International companies represented by MSCI EAFE Index. US companies represented by S&P 500 Index, Canadian companies represented by S&P/TSX Composite Index.
1 The difference in average rolling returns over the 3-, 5-, 10-, and 15-year periods from Jan 1, 2000 to Apr 30, 2022 was 2.2 percentage points, 2.1 percentage points, 2.0 percentage points, and 2.0 percentage points, respectively. The difference in standard deviation is 1.7 percentage points, 1.6 percentage points, 1.8 percentage points, and 1.7 percentage points, respectively. Commissions, trailing commissions, management fees and expenses all may be associated with mutual Fund investments. Please read the prospectus before investing. Mutual Funds are not guaranteed, their values change frequently, and past performance may not be repeated. The content of this collateral (including facts, views, opinions, recommendations, descriptions of or references to, products or securities) is not to be used or construed as investment advice, as an offer to sell or the solicitation of an offer to buy, or an endorsement, recommendation or sponsorship of any entity or security cited. Although we endeavour to ensure its accuracy and completeness, we assume no responsibility for any reliance upon it.