QTIP – Q&A on performance and distributions

As inflation moved rapidly to a multi-decade high in 2022, Treasury Inflation-Protected Securities (TIPS) ETFs became a popular investment option to help protect portfolios. But understanding how TIPS work is not always straightforward. They have some unique characteristics that can sometimes make the investing experience confusing.

Here are answers to some of the most frequently asked questions about TIPS.

What are TIPS and how do they work?

TIPS are bonds issued by the US government that are designed to protect investors from the risk of higher-than-expected inflation. TIPS are indexed to changes in the Consumer Price Index (CPI). To achieve this, the principal value is adjusted upwards when inflation increases and downwards when CPI decreases. This adjustment is based on two months prior to CPI being applied to the fund’s underlying securities.

When the bonds mature, investors receive the greater amount of either the adjusted principal or the original principal (investors never receive less than their original investment). TIPS pay out a fixed coupon rate, which is calculated based on the new principal amounts, so, like the principal, interest payments rise with inflation and fall with deflation.

For more specific details on how TIPS work, please refer to our What are TIPS? piece.


Where do TIPS fit on your portfolio?

Our view is that TIPS should be considered a long-term strategic core allocation due to diversification, inflation protection and long-term total return benefits they may provide. 

Diversification

TIPS have historically exhibited low to negative correlation with traditional asset classes, which can help reduce a portfolio’s overall volatility. And because TIPS are US government Treasury bonds, they tend to withstand periods of credit distress and equity market downturns better than other asset classes.


TIPS correlation with traditional equity

Source: Morningstar. TIPS represented by the ICE US Treasury Inflation Linked Bond Index. As at August 31, 2023
 

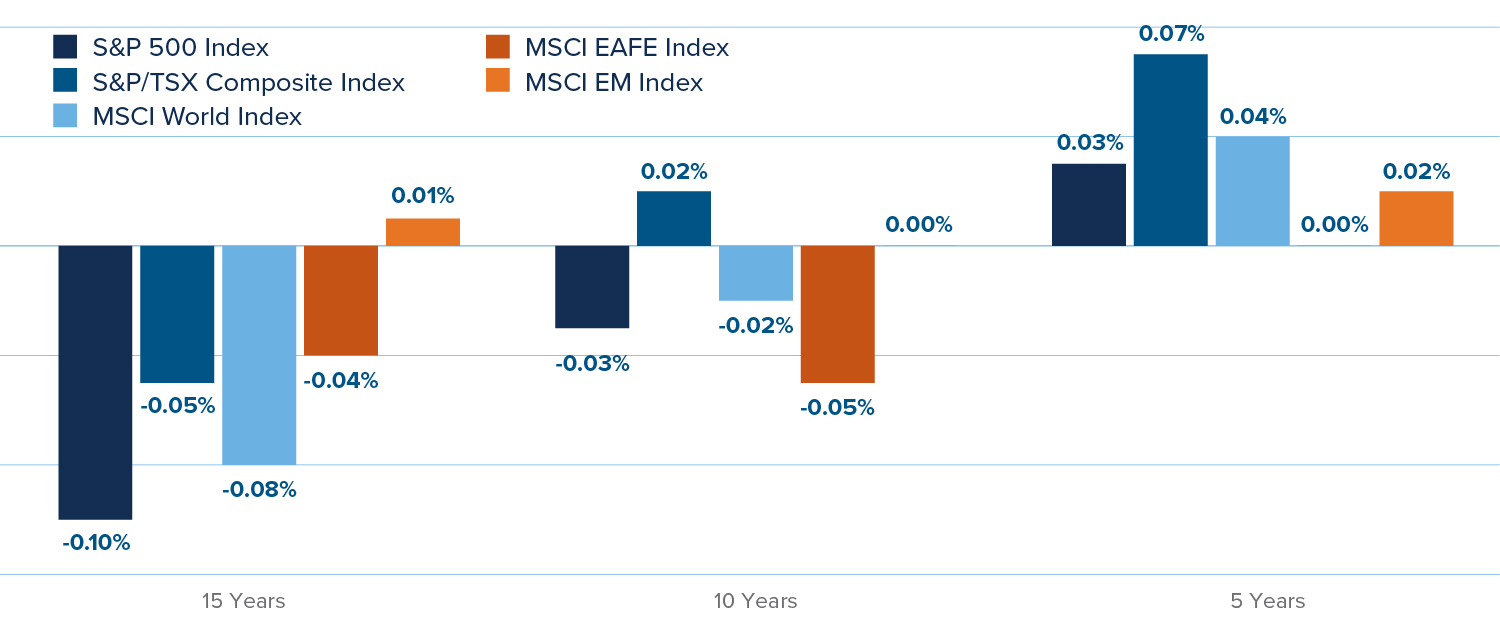
Inflation protection

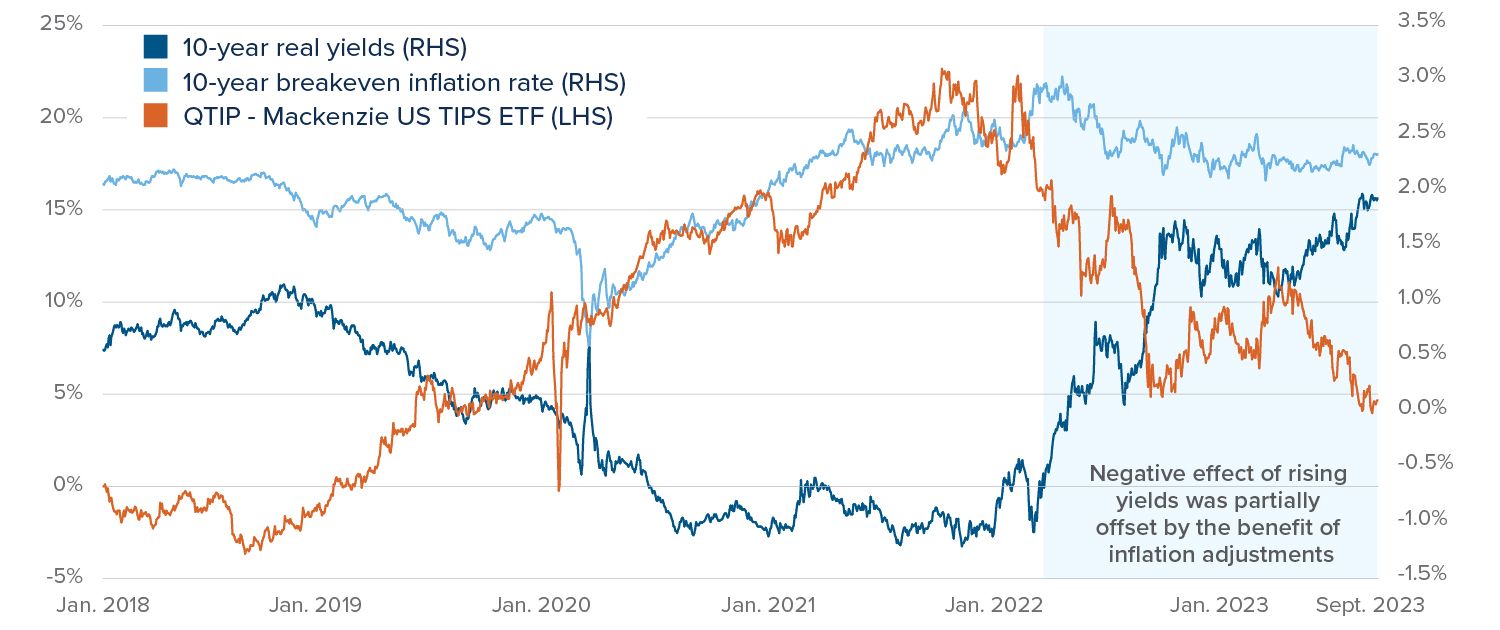
TIPS are designed to help investors preserve their purchasing power and protect their investment returns as their principal is adjusted for inflation. Inflation is particularly concerning for bondholders since it can erode the value of future interest and principal payments. TIPS offer a “real” rate of return that adjusts for inflation as interest is paid on the adjusted face value of the bond, creating a gradually rising stream of interest payments, as long as inflation continues to rise.

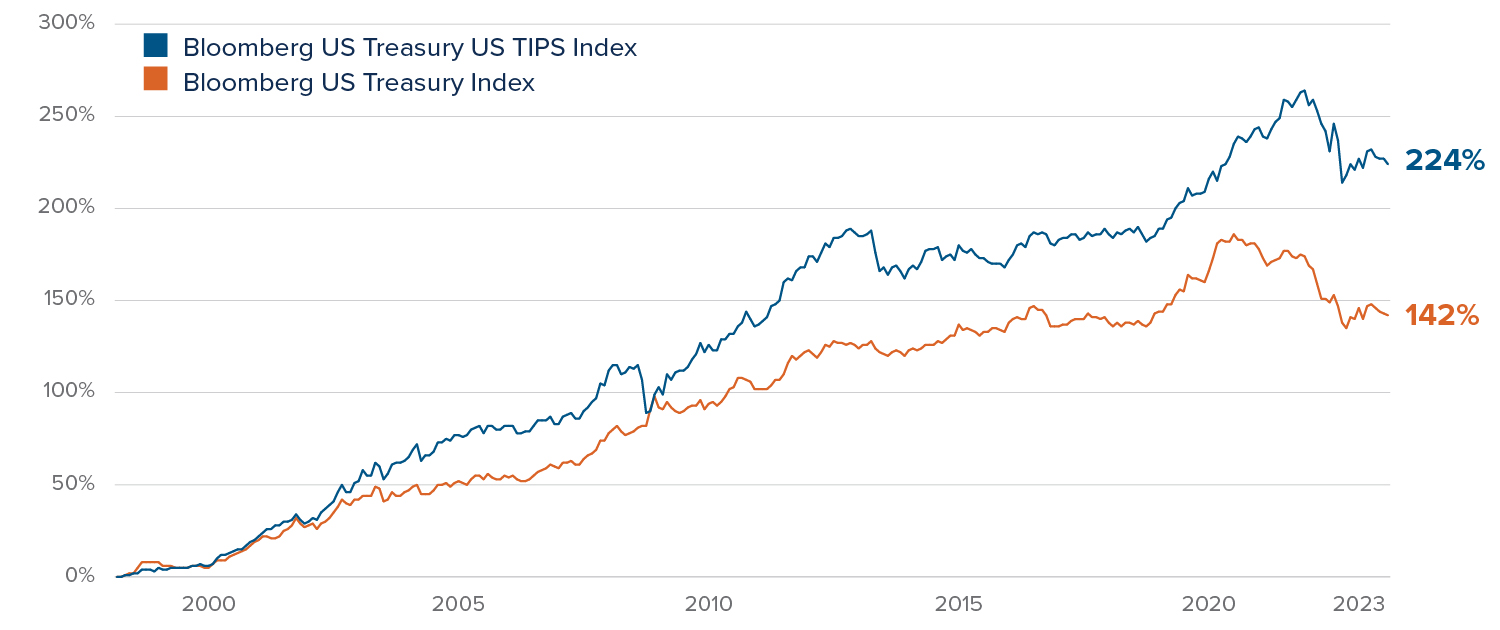
Long-term total return

The compounded effect of principal adjustment helps TIPS deliver a better long-term total performance relative to nominal bonds.

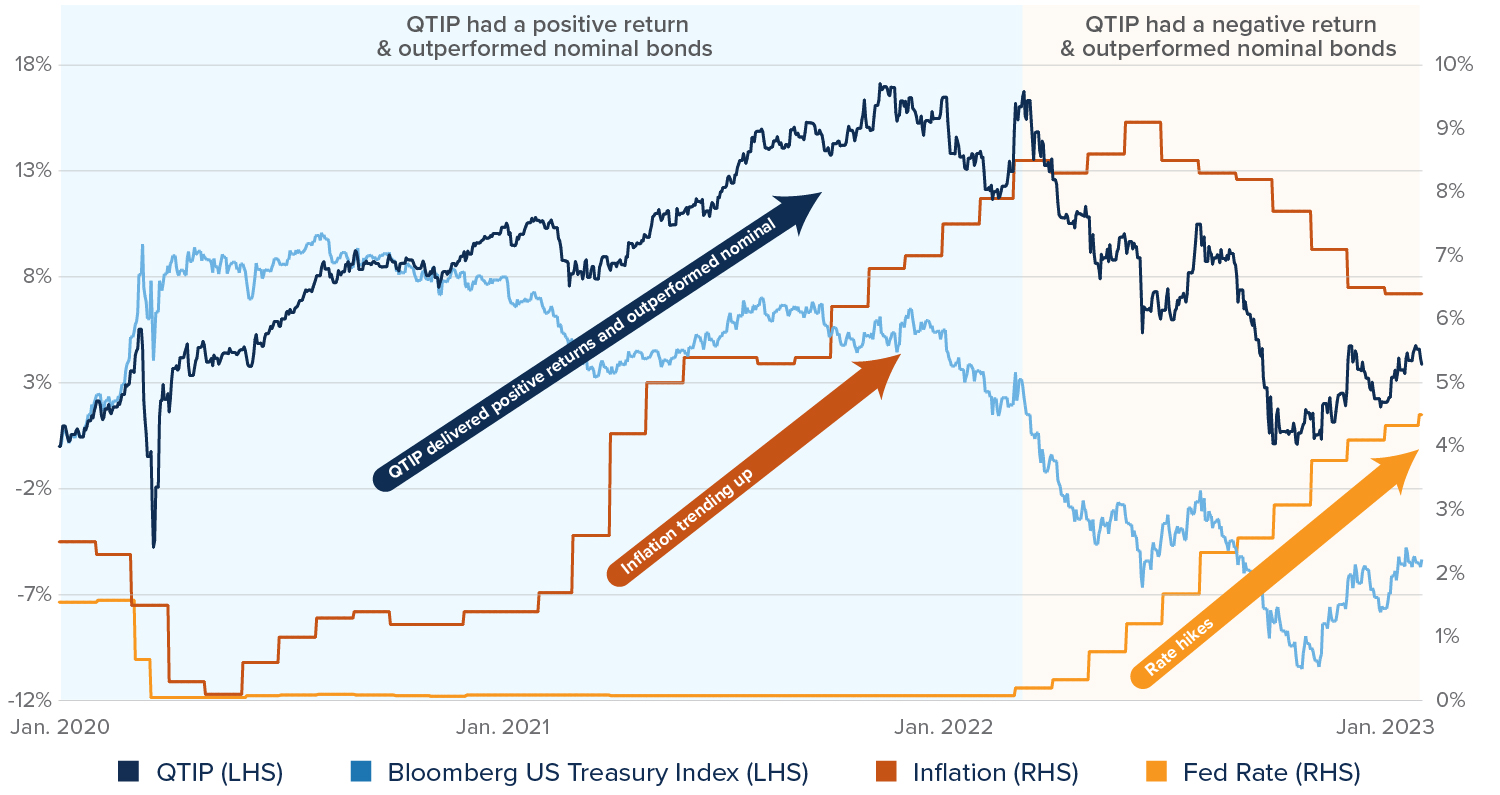
Inflation protected versus nominal bonds

Source: Morningstar. Since common inception (April 16, 1998) to August 31, 2023.


What factors drive TIPS performance?

The performance of TIPS is largely driven by changes in inflation expectations and interest rates.

TIPS are more sensitive to changes in inflation expectations, rather than actual inflation. Current inflation expectations are often already priced by the market and may not have a significant impact on the performance of TIPS. Inflation expectations are typically measured by the break-even inflation rate, which is the inflation level required for investors to be indifferent between holding a nominal bond or an inflation-linked bond with the same maturity.

While TIPS do not carry credit risk (due to the US government guarantee), like all bonds, they are subject to interest rate risk. The bond values and interest rates move in opposite directions, so the value of TIPS drop as the rates increase and inversely, rise in value during falling rate periods.

The sensitivity to changes in interest rates is measured by duration. As an example, Mackenzie US TIPS Index ETF (CAD-Hedged) (QTIP) has a duration of approximately seven years, which means that if real yields increased by 1%, the price of QTIP may fall by 7%.

Using QTIP as an example, the chart below illustrates the combined effect of inflation (breakeven rate) and interest rate (real yields) on QTIP’s performance.

Combined effect of inflation and interest rate on QTIP’s performance January 24, 2018, to August 31, 2023

Source: Bloomberg, based on daily data. 10-year real yields represented by generic inflation indexed United States 10-year government bonds. 10-year breakeven inflation rate represented by US Breakeven 10 Year index.


In March 2022, the US Federal Reserve began an aggressive rate hike campaign to combat rising inflation. Through year end, the rates increased by a total of 4.25%, which was the fastest rate hike cycle in decades. During the same period, QTIP registered a loss of 11%, primarily due to its duration risk amid the unprecedented speed of the rate hike cycle.


Do high CPI numbers always lead to positive performance for TIPS/QTIP?

Given that TIPS are government issued bonds, they are also sensitive to interest rate risk (as interest rates increase prices for existing bonds decline and vice versa).

Looking back to the example of QTIP again, QTIP’s total return is driven by the combined effect of inflation trends and interest rates. When rates rise and CPI is low, QTIP’s price may decline due to a lower coupon and lack of inflation adjustment, which can lead to negative total returns. Similarly, when rates rise and consumer prices rise, total returns would benefit from both price appreciation and the inflation adjustment. An environment where CPI exceeds expectations and rates decline would be the most favourable for the performance of a TIPS ETF such as QTIP.

Below are highlights of the impact of inflation and real yields changes on QTIP performance since 2020.

January 2020 to June 2020: QTIP generated positive performance despite the negative inflation surprises as the price gains from the decline in 10-year real yields outweighed the negative impact from the inflation adjustments.

March 2021 to July 2021: QTIP gained 7% and benefited from both inflation adjustments (CPI exceeded expectations) and bond price appreciation as real yields declined by 54 basis points (bps).

July 2021 to February 2022: QTIP’s performance was flat but volatile. The positive impact of inflation adjustment was offset by bond price decreases due to the increase in real yields.

March 2022 to November 2022: QTIP’s performance was negative because of the adverse pressure of rising rates on the bond prices (the US Federal Reserve hiked rates by 25 bps in March, 50 bps in May, 75 bps in June, 75 bps in July, 75 bps in September, and 75 bps in November), that outpaced the effect of the positive inflation surprises during the same period.

December 2022 to August 2023: QTIP’s performance slightly improved as yield pressure decreased (rates are close to the US Federal Reserve’s neutral target), while the inflation effect is neutral to slightly negative.  


Why are TIPS/QTIP distributions not consistent?

Unlike nominal Treasury bonds that have consistent coupon payments, TIPS ETFs distributions can fluctuate from one month to another because they’re tied to CPI, which may be volatile from month to month. Distributions from TIPS ETFs consist of accrued coupon income and the principal inflation adjustment. The inflation adjustment is based on two months’ prior CPI applied to the fund’s underlying securities. ETF distribution yields may fluctuate due to short-term fluctuations in CPI, lag in CPI data, as well as due to differences in calculation conventions and distribution schedules among different ETF sponsors.


Can monthly cash distributions decline when CPI readings are high?

Inflation adjustment is mainly driven by month-to-month changes in CPI rather than absolute CPI prints. A high inflation number is a relative term and may still lead to a decline in monthly distribution if a given month’s change is less than the previous month’s change.

In addition, there are delays between the time CPI is released and when it’s considered as part of the calculation for a distribution. For example, the CPI reading for the month of January will not be released until mid-February. That inflation adjustment may not be reflected in the fund distribution until a month or two later, when the calculation methodology takes this adjustment into account.

Looking back at QTIP, below are two examples of recent CPI increases and decreases and their impact on the fund’s distributions: 

  • April 2021’s CPI print increased significantly relative to the previous month (from 2.6% to 4.2%), the TIPS adjustment was applied two months later and is reflected in QTIP’s July distribution (which increased from $0.11 to $1.20).

Because QTIP pays out the earned income of the portfolio, including an inflation adjustment based on two months' prior CPI applied to the fund's underlying securities, when inflation trends higher, investors received a high distribution that reflected the inflation increase.

  • July 2022’s CPI print decreased relative to the previous month (from 9.1% to 8.5%), the TIPS adjustment was applied two months later and is reflected in QTIP’s October distribution (which decreased from $1.22 to $0.81).

But, when inflation turns flat to slightly negative for a period, even if year-over-year inflation numbers are still high, the distributions drop to the Treasury bond coupons’ level, or lower in some cases, because of the downward principal adjustment.


Did QTIP protect against inflation?

US Inflation started an uptrend in June 2020 and peaked in June 2022 at 9.1%. During that period, QTIP delivered a return of 7.14% compared to -3.13% for the nominal Treasury bonds (1,027 bps of outperformance). The weak performance following the inflationary period was caused by the aggressive rate hikes that resulted in widespread bond losses among many other fixed income asset classes, including nominal Treasuries, investment grade corporate bonds and high yield bonds.

Effect of rising inflation and rates on QTIP & nominal bonds

Source: Morningstar, as at January 31, 2023.

Key takeaways

  • QTIP may be an attractive portfolio solution for investors looking to protect against inflation, reduce correlation between asset classes and earn long-term capital gains.
  • Like other fixed income products with interest rates exposure, QTIP may face headwinds when rates increase due to duration, however the periods of rate tightening are typically short, and the high duration could be an advantage when the rate cycle is reversed.
  • QTIP’s distributions were among the highest during 2022, reaching double digit yields because of the inflation adjustments, but since these distributions are linked to CPI, there could be some volatility from one month to another (for example, a three-month delay to see the influence of CPI on the distributions).
  • During the recent inflationary period, the data shows that QTIP protected against inflation and outperformed nominal bonds, but the absolute performance turned weak in the second half of 2022 because the aggressive rate hikes diluted the effect of the inflation adjustments.


1 year

3 years

5 years

Since inception (01/2018)

QTIP – Mackenzie US TIPS Index ETF (CAD-Hedged)

0.8%

-2.4%

1.4%

1.1%


Source: Mackenzie Investments, as at September 30, 2023.

Commissions, management fees, brokerage fees and expenses may all be associated with Exchange Traded Funds. Please read the prospectus before investing. The indicated rates of return are the historical annual compounded total returns including changes in unit value and reinvestment of all distributions, and do not take into account sales, redemption, distribution, or optional charges or income taxes payable by any security holder that would have reduced returns. Exchange Traded Funds are not guaranteed, their values change frequently, and past performance may not be repeated.

The content of this document (including facts, views, opinions, recommendations, descriptions of or references to, products or securities) is not to be used or construed as investment advice, as an offer to sell or the solicitation of an offer to buy, or an endorsement, recommendation or sponsorship of any entity or security cited. Although we endeavour to ensure its accuracy and completeness, we assume no responsibility for any reliance upon it.

Index performance does not include the impact of fees, commissions, and expenses that would be payable by investors in the investment products that seek to track an index.

The Mackenzie ETFs are not sponsored, promoted, sold or supported in any other manner by Solactive nor does Solactive offer any express or implicit guarantee or assurance either with regard to the results of using the Indices, trade marks and/or the price of an Index at any time or in any other respect. The Solactive Indices are calculated and published by Solactive. Solactive uses its best efforts to ensure that the Indices are calculated correctly. Irrespective of its obligations towards the Mackenzie ETFs, Solactive has no obligation to point out errors in the Indices to third parties including but not limited to investors and/or financial intermediaries of the Mackenzie ETFs. Neither publication of the Solactive Indices by Solactive nor the licensing of the Indices or related trade mark(s) for the purpose of use in connection with the Mackenzie ETFs constitutes a recommendation by Solactive to invest capital in said Mackenzie ETFs nor does it in any way represent an assurance or opinion of Solactive with regard to any investment in these Mackenzie ETFs. This should not be construed to be legal or tax advice, as each client’s situation is different. Please consult your own legal and tax advisor.