Highlights
- We estimate the federal government’s deficit and debt paths are much more dire than budgeted only five months ago in the fall economic statement.
- Even if the government doesn’t announce any new spending in the 2024 budget, it would already have broken all three of the “fiscal rules” it set for itself in the fall economic statement.
- The upcoming budget could be the first since the 2014 budget not to announce fresh net spending.
In its most recent fall economic statement (FES), the federal government set itself a fiscal anchor, consisting of three precise rules:
- Maintain the 2023-2024 deficit below $40.1 billion.
- Lower the debt-to-gross-domestic-product (GDP) ratio in 2024-2025 and keep it on a declining path thereafter.
- Keep deficits below 1% of GDP starting in 2026-2027 and on a declining path before then.
Less than five months later, the government is already at risk of breaking all three. By our estimation, even before any potential new spending announcements in the 2024 budget, the federal government’s deficit and debt paths are “un-anchored” according to the government’s own rules.
We expect the deficit for the current fiscal year to be around $48 billion, well above the $40.1 billion budgeted in the 2023 FES and as threshold for the first fiscal rule. The Department of Finance’s Fiscal Monitor publications, which tally revenues and spending for the current fiscal year, has shown a deterioration in monthly balances since last summer, around the same time the Canadian economy clearly started to sputter.
The likely deficit path is much more dire than estimated in the 2023 FES
Federal deficit as a percentage of GDP
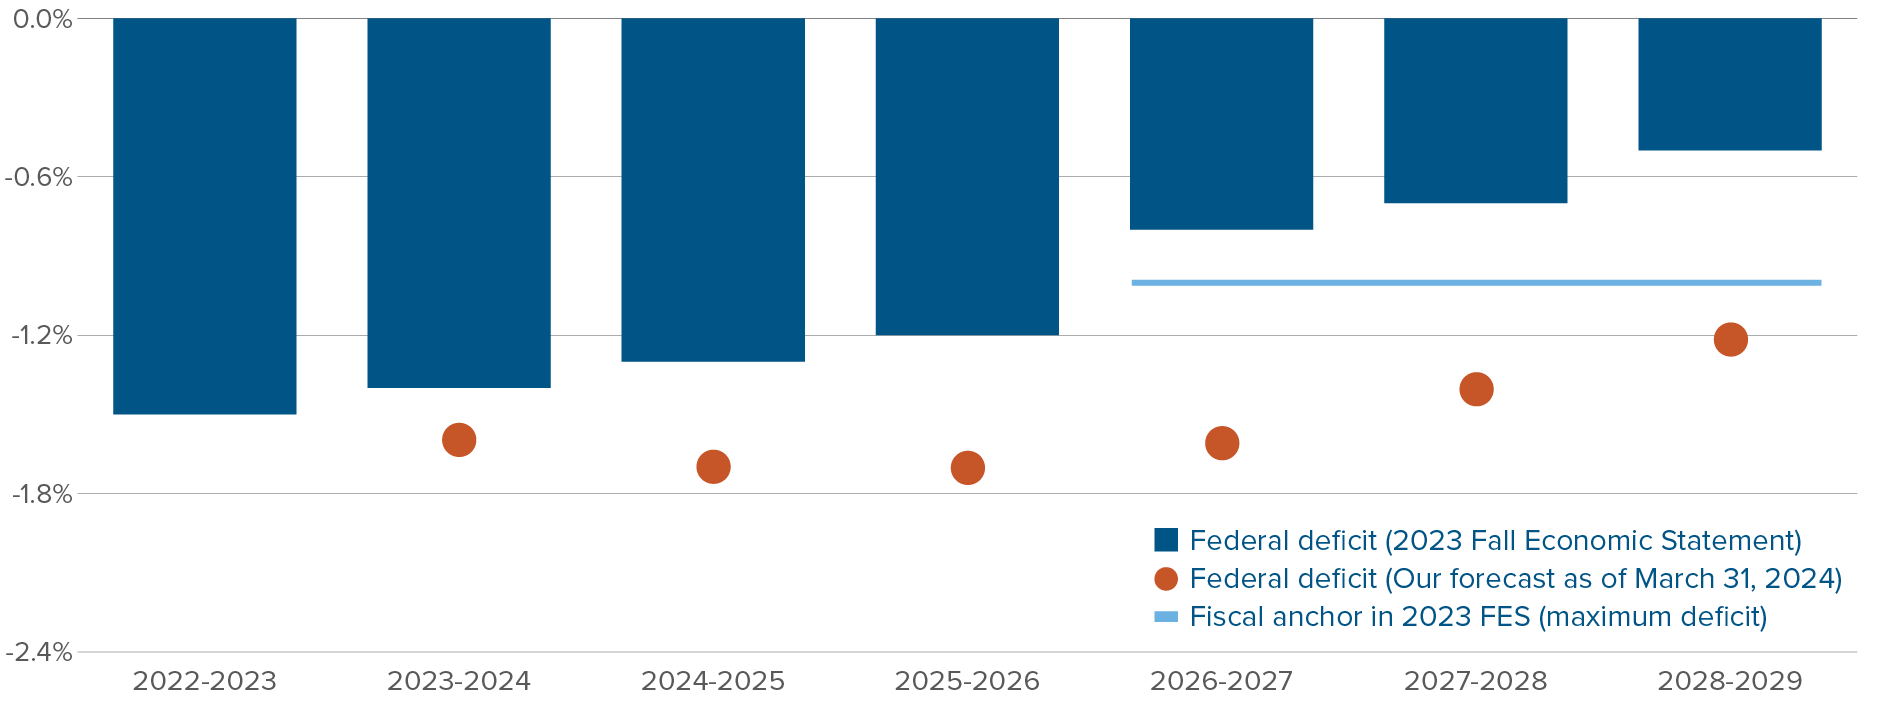
Not only do we forecast the deficit to be higher than planned this year, but we expect it to overshoot the FES path and stay above 1% for the foreseeable future, breaking the government’s third fiscal rule. While solid GDP growth in the first quarter of 2024 and rising oil prices are good news for the government’s finances in the short-term, their positive impact is minimal. A handful of factors explain the higher projected deficits over the forecast horizon:
- Ballooning program spending, in part reflecting the recent public sector hiring spree and new collective bargaining agreements.
- Lower tax revenues from an undershoot of growth and inflation over the horizon.
- Lower growth and government revenues from the recently announced cap on non-permanent residents.
- Higher defense spending.
- The budgeting of the government’s pharmacare plan, central to its alliance with the New Democratic Party (NDP).
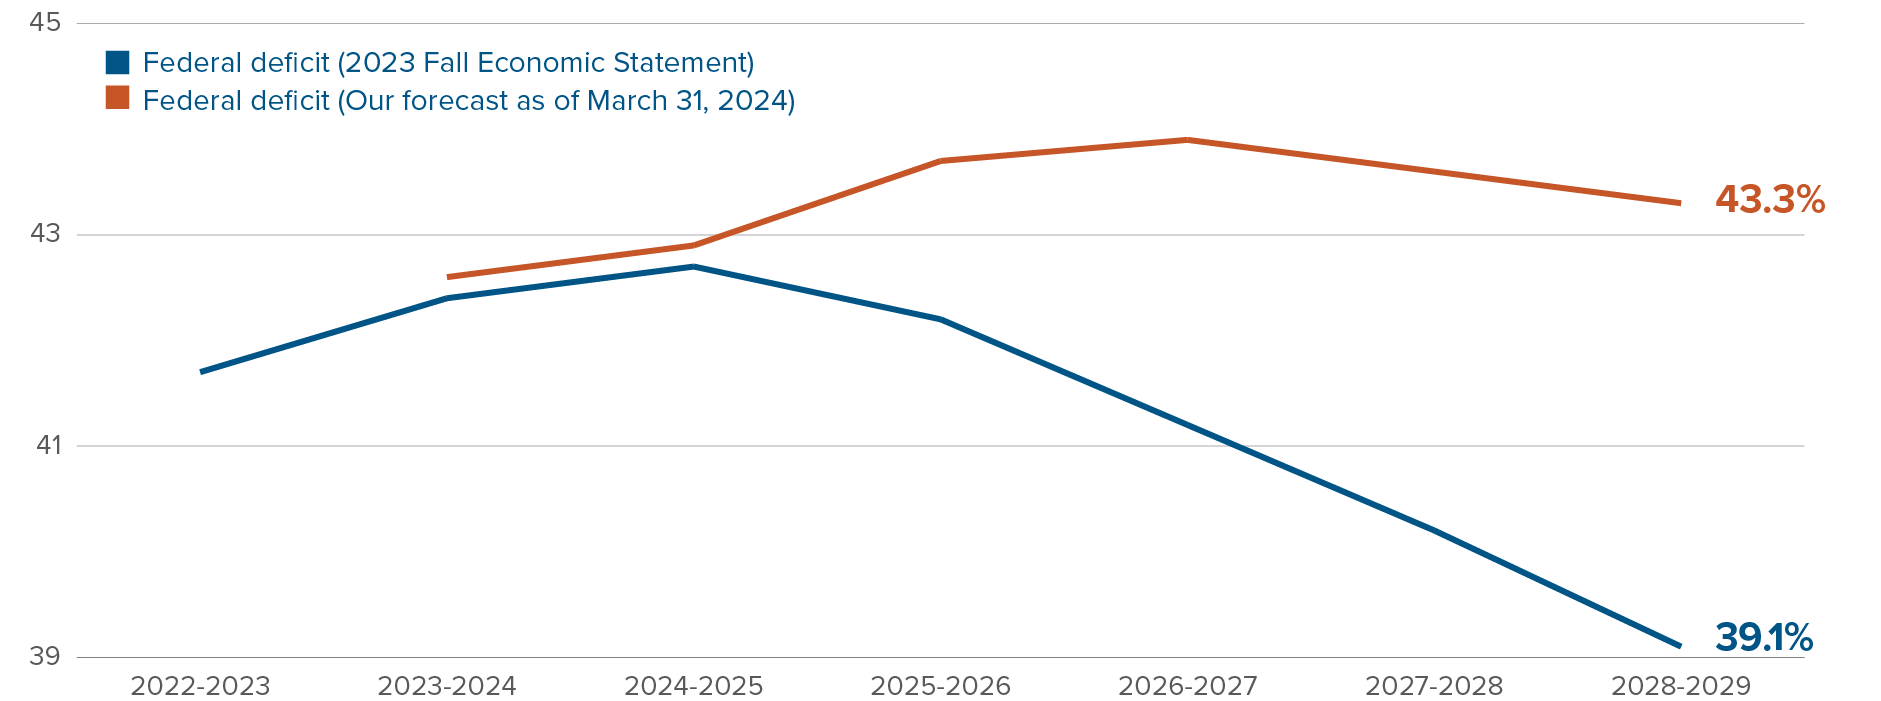
Because of higher projected deficits, the federal debt-to-GDP ratio probably won’t be trending down over the next few years, which would break the FES’s second fiscal rule. We project that the federal debt will rise from 41.7% last year to 44% in 2026-2027.
The debt burden is not on track to decline over coming years
Federal government debt-to-GDP ratio
With public finances already having deteriorated since the 2023 FES, we expect the upcoming budget to be light on new net spending. Public opinion has shifted towards tighter budgets over the past year, and the government has taken notice. A fiscally neutral budget can come either from lower spending or higher revenue. Given the government’s pact with the NDP, the effort will likely come from revenues, not spending. The government could possibly lean on an increase in the capital gains inclusion ratio, a bump to the top income tax bracket or a wealth tax to compress projected deficits.
Canadian productivity growth has been dismal. Any new budget measure should aim to reverse that trend, or at least avoid accelerating it. Unfortunately, the federal government has limited power in loosening the regulatory constraints around building in cities, the main culprit for Canada’s acute housing crisis and economic stagnation. But anything it can do to help on that front should be pursued.
Real GDP per capita is 3.4% below its 2022 peak
Real GDP per capita, Canada, 2017 constant dollars, thousands
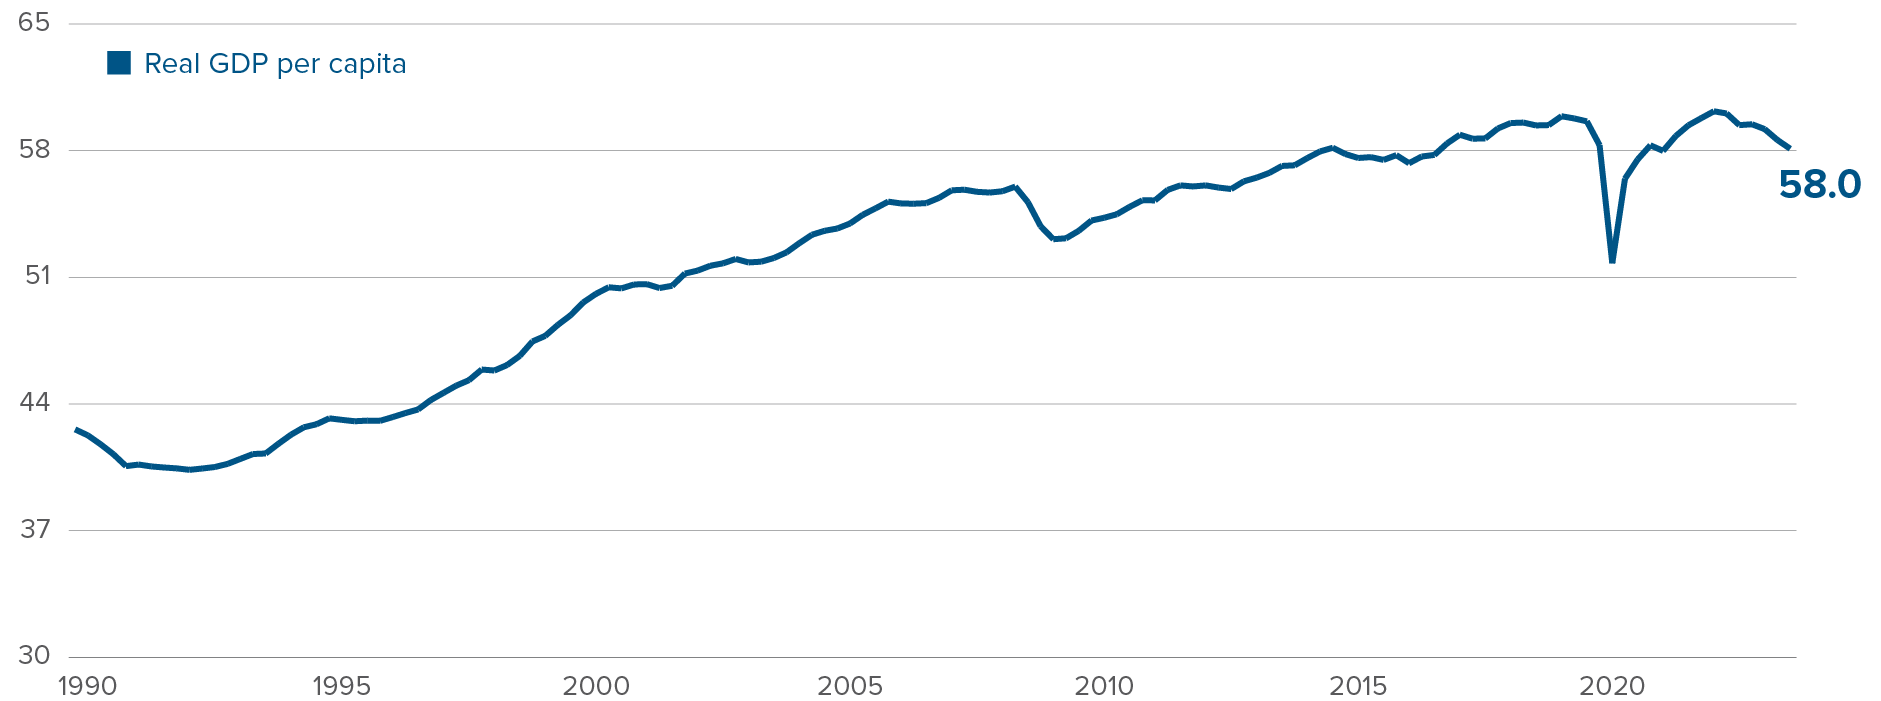
While productivity growth was already weak in the 2010s, the picture has gotten uglier in the 2020s. pre-COVID, the stagnation in GDP per capita was mostly explained by population aging. Real GDP per working-age adult, which controls for the effect of Canadians entering retirement on economic production, grew 1.3% per year between 2014 and 2019, a decent if unspectacular pace. Today, it sits 1.6% below its 2019 level.
Real GDP per working-age adult has been trending down
Real GDP per Canadian between 15 and 64 years old, normalized to 100 in 2019
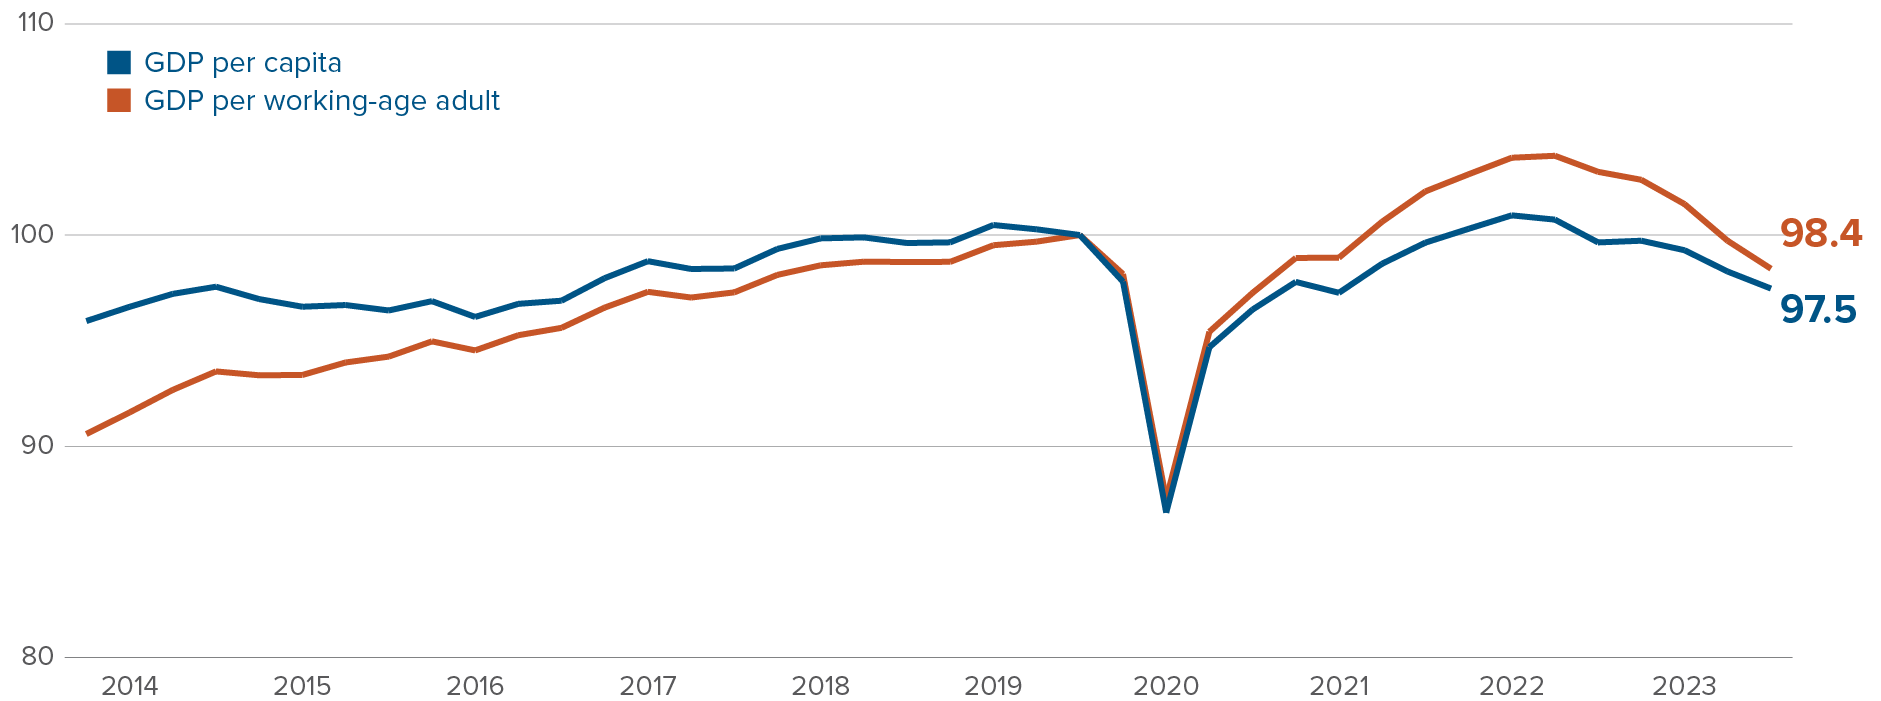
Part of the recent decline in GDP per capita and GDP per working-age adult is a temporary compression from an acceleration of immigration. It takes some time for new permanent residents to settle into jobs suited for their skills. Once they do, we’ll see some reversal in the productivity slump. But with depressed business investment and a crippling housing shortage, such a reversal likely won’t take us back to the pre-pandemic productivity growth path. By encouraging investment and facilitating building, the 2024 budget can be part of the solution.
Capital markets update
What we’ll be watching in April
April 11: European Central Bank policy decision
- Economic news out of the euro zone has been unambiguously good in 2024. Growth has picked up while inflation has cratered.
- We expect the European Central Bank to initiate rate cuts before the Federal Reserve, which informs our preference for European bonds over North American government bonds.
April 25: US GDP, first quarter of 2024
- GDP growth for the fourth quarter of 2023 was revised upward, from 3.2% to 3.4% on March 28, confirmation that the US economy ended last year on a heater.
- The Atlanta Fed’s nowcasting model sees first quarter real GDP growth clocking in at 2.3%. Such a solid reading would further reduce the Fed’s urgency in initiating rate cuts.
Emerging theme: How long can the Canadian curve stay inverted?
The Canadian yield curve is acutely inverted. The yield on a 2-year Government of Canada (GoC) bond currently sits 0.71% above the yield on a 10-year bond. That’s a higher spread than all other developed country bond curves. In particular, US Treasuries have a 10-2 yield spread of -0.42%, 29bps higher than that on GoC bonds.
The Canadian yield curve is inverted in large part because investors expect the Bank of Canada’s policy interest rate to stay above its long-term average for a few years still. The market is pricing in only three rate cuts in 2024, which would leave rates well above a long-term “neutral” rate, currently around 3.5%.
With both headline and core inflation rates in Canada recently collapsing below 2% on a three-month annualized basis, the Bank of Canada will soon have all the ingredients for cuts. We think that when the Bank begins cutting, it will do so at a steady pace, getting back to neutral in 2025. With inflation under control in Canada, the Bank won’t have a reason to keep its current tight stance of policy.
We don’t want to bet on GoC bonds rallying, even if we expect early and steady rate cuts. Population growth and government deficits should keep pressure on long-term yields. But we do think the curve will steepen. By taking a long position in short-term GoC bonds and a short position in long-term GoC bonds in the Mackenzie Global Macro Fund, we’re (1) benefiting from higher relative yields on short-term bonds and (2) positioning ourselves for an un-inversion of the Canadian yield curve.
The 10-2 spread is more negative in Canada than in any other advanced country
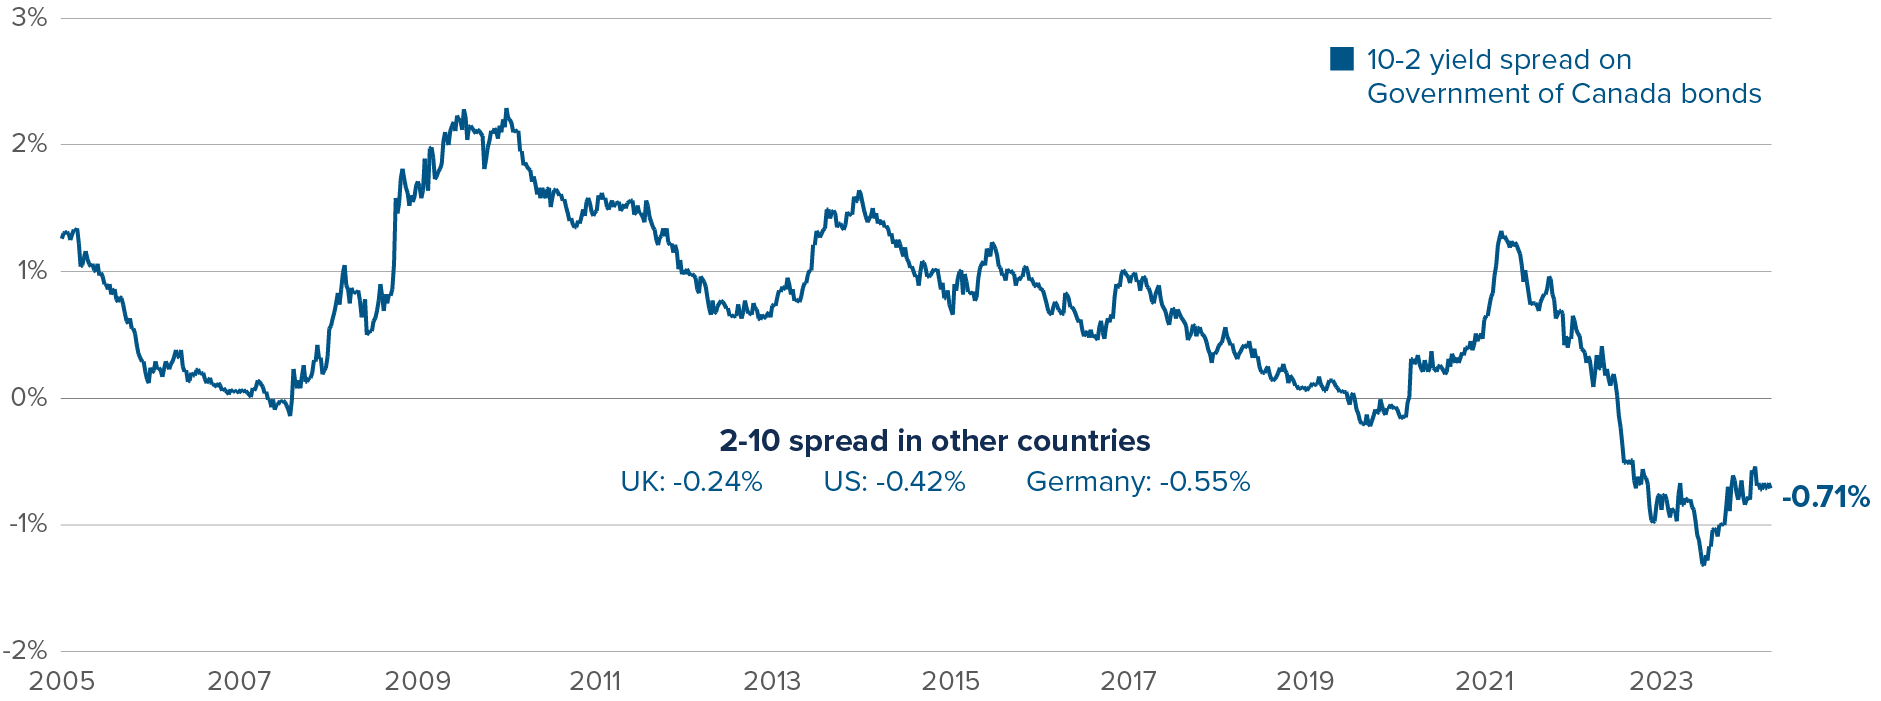 Source: Bloomberg as at March 31, 2024.
Multi-Asset Strategies Team’s investment views
Tactical summary
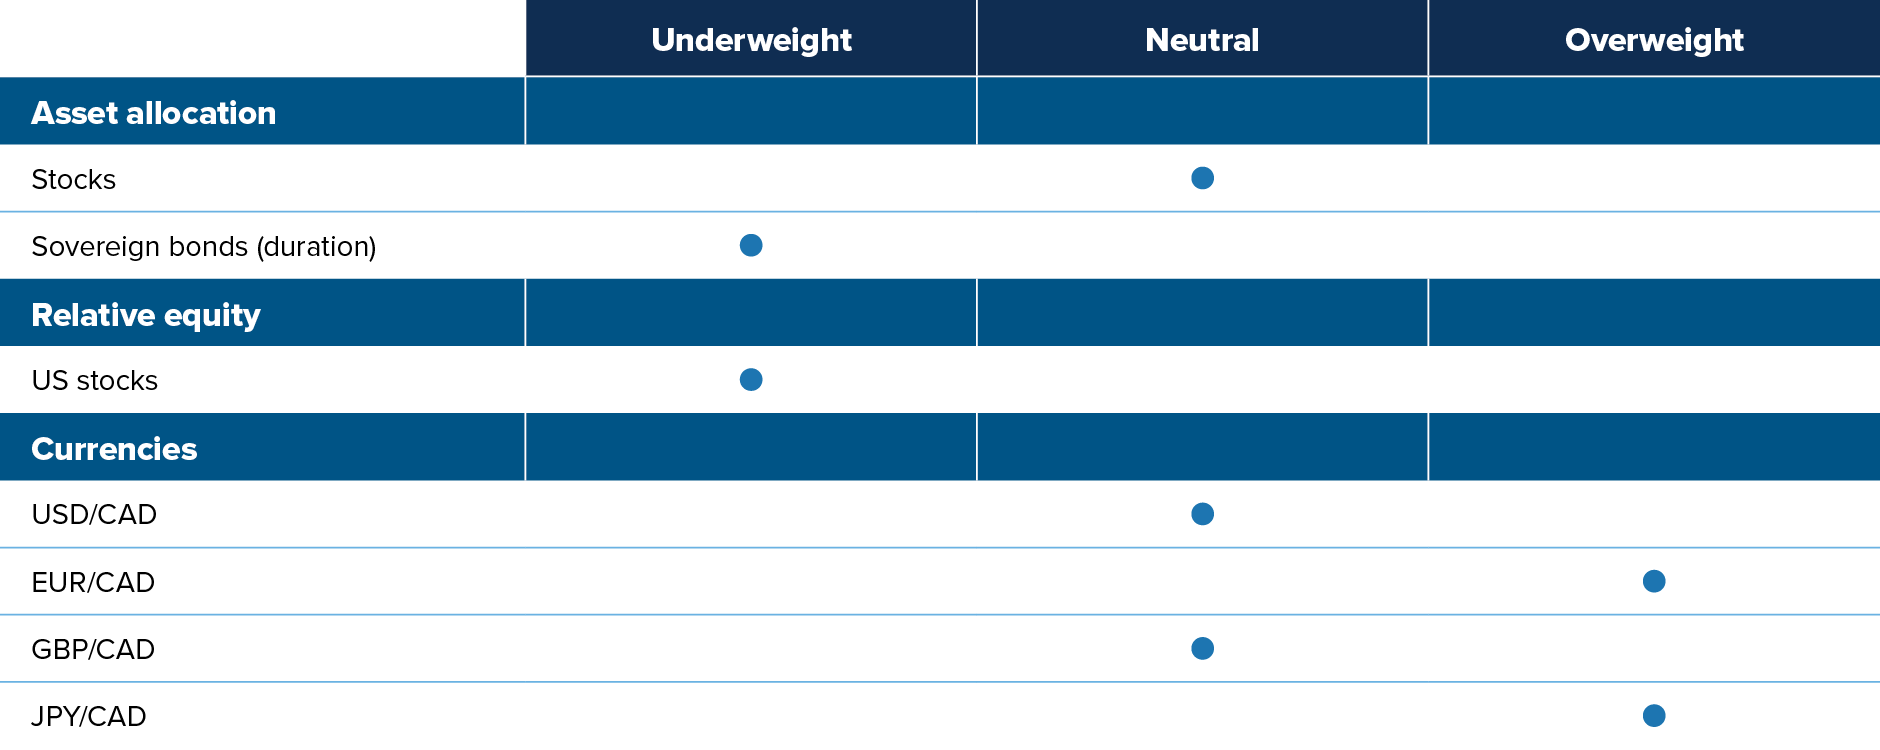
Note: The views expressed in this piece apply to products that are actively managed by the Multi-Asset Strategies Team.
Positioning highlights
Fed pricing reversal: At the start of the year, markets were expecting six Fed rate cuts in 2024. That was a stretch in our view, given the hot economy and the “transitory” forces behind recent disinflation. After upside surprises in economic releases, markets trimmed revised those expectations down to five cuts at the end of January, and now down to three cuts. This is more reasonable, but we'll still take the under. We don't see inflation stabilizing at 2% over the next few months given the recent uptick in various inflation measures and the continued strength of the US economy. We also think the Fed will err towards keeping rates tighter than what a classic monetary policy rule would suggest. FOMC members understand that the recent market action suggests financial conditions have loosened significantly in recent months, in effect substituting for rate cuts.
Overvalued US assets: We generally don’t like US assets, whether equities, bonds or the US dollar. Within US equity markets, we prefer small-cap stocks: valuations are more attractive than large caps, and market sentiment is improving quickly. In terms of sectors, we like health care (pricing power in inflationary environment, bullish trends) and dislike utilities (declining profitability, poor macro backdrop).
Canadian landing: The macro situation in Canada appears much more dire than in the US. Data has already started turning. The Sahm Rule, which uses changes in the unemployment rate to date recessions, is flashing red. We dislike the Canadian dollar against most currencies and are betting on a steepening of the Canadian yield curve.
Commodity-exporting EM currencies: Commodity-exporting EMs are well situated to outperform in this macro environment. Their budgetary and external balances have improved amid high global nominal growth and high commodity prices. Their central banks started raising rates much earlier than the rest of the world. As a result, they have generally reached the end of their tightening cycle, reducing the risk of overtightening into a recession. But the level of rates remains high, offering positive carry over most other currencies. On the other hand, we hold a negative view on the currencies of Asian EM countries. Their external positions have severely deteriorated, and their interest rates are relatively low.
Oil market tightness: The physical oil market is tight, especially with the ongoing one-million-barrel-per-day Saudi production cut and upcoming refill program for the US Strategic Petroleum Reserve. In the absence of a global recession, which we don’t expect to occur anytime soon given the positive momentum in the US and the expansionary deficits from governments around the world, oil should remain undersupplied. A stabilization of the Chinese economy will trim risks around oil demand. Positioning is also constructive for the oil complex. For much of 2023, investors were expressing recession bets through short oil derivatives positions. These bets have been coming off, with room to run.
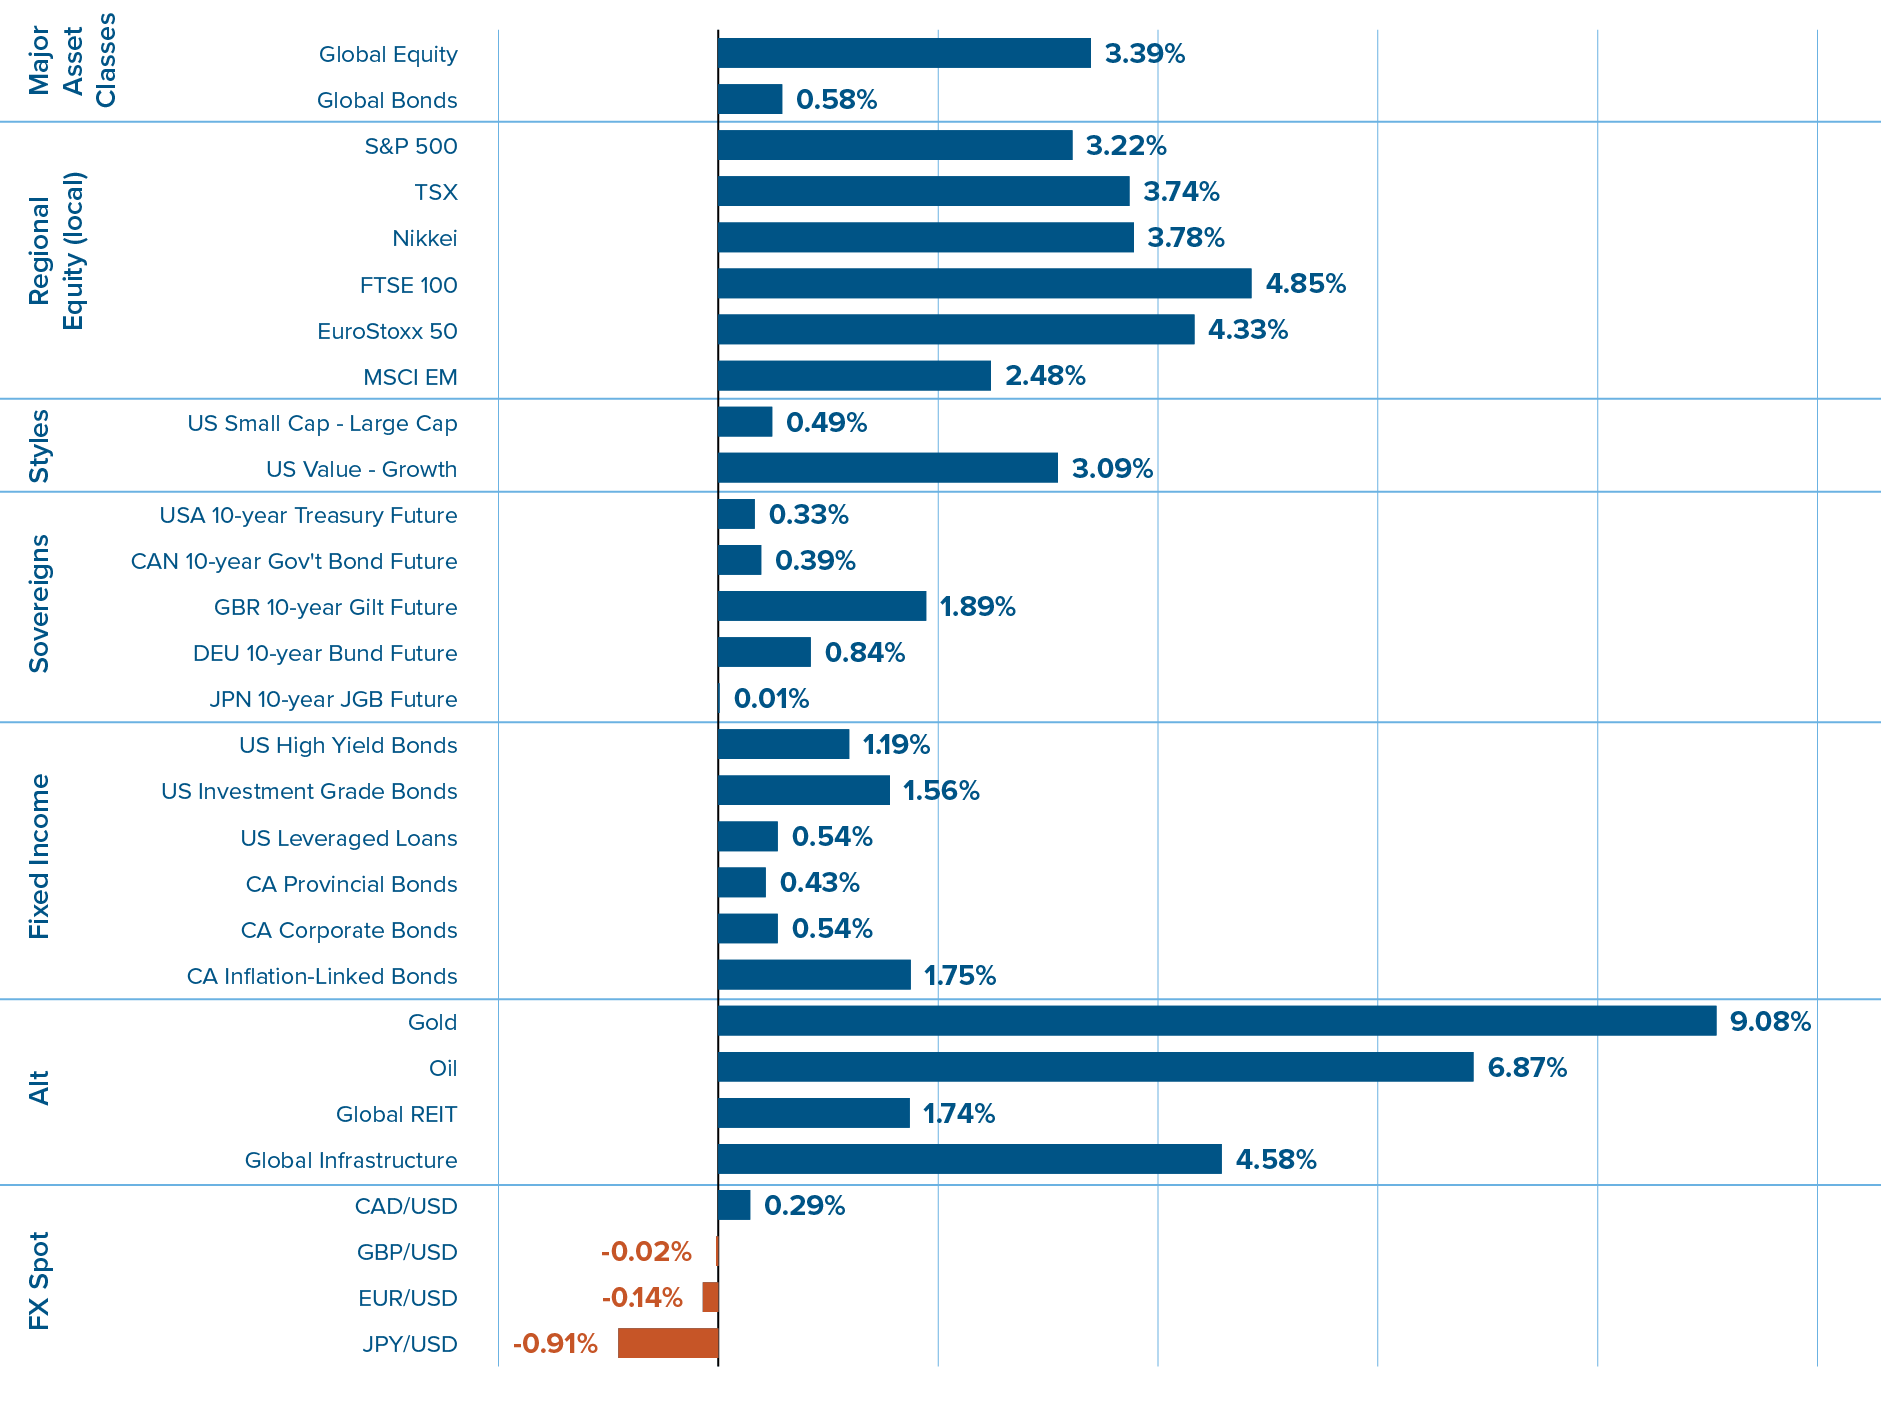
Capital market returns in March